
Page 103 - CityofWataugaAdoptedBudgetFY24
P. 103
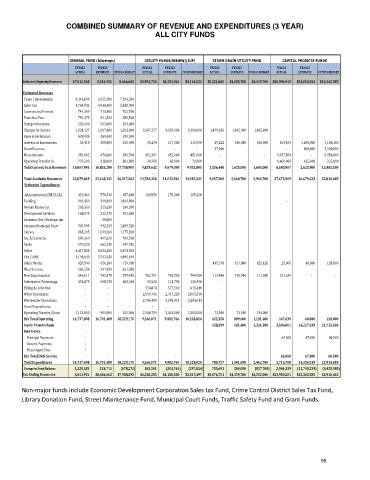
COMBINED SUMMARY OF REVENUE AND EXPENDITURES (3 YEAR)
                                                    ALL CITY FUNDS


                        GENERAL FUND (&Strategic)  UTILITY FUNDS(W&WW)(JUF)  STORM DRAIN UTILITY FUND  CAPITAL PROJECTS FUNDS
                          FY2022          FY2023      FY2022          FY2023      FY2022          FY2023      FY2022          FY2023
                          ACTUAL  ESTIMATE  FY2024 BUDGET  ACTUAL  ESTIMATE  FY2024 BUDGET  ACTUAL  ESTIMATE  FY2024 BUDGET  ACTUAL  ESTIMATE  FY2024 BUDGET
         Estimated Beginning Resources  $7,012,568        8,341,951        8,466,662  $3,954,724  $4,333,964  $4,114,521  $3,321,060  $4,035,700  $4,319,700  $20,994,942  $24,053,824  $12,345,585

         Estimated Revenues
          Taxes / Assessments           6,446,896         6,652,500         7,194,500
          Sales Tax             4,705,981         4,940,400         5,038,000
          Licenses and Permits               741,399             713,800             762,700
          Franchise Fees               791,372             891,500             889,500
          Intergovt Revenue               502,600             503,000             503,000
          Charges for Service           1,024,127         1,067,000         1,203,000          9,307,277          9,050,000         9,300,000         1,479,826         1,485,000         1,485,000
          Fines & Forfeitures               638,906             469,400             559,500                       -                        -
          Interest on Investments                  55,418             300,000             350,000                35,234             117,000             110,000               29,222            140,000            160,000              163,463            1,200,800           1,100,100
          Grant Revenue                         -                        -                       -                        -                        -                        -                27,400                        -                800,000           3,200,000
          Miscellaneous               381,082             470,600             389,700             452,361             452,000             451,000                      -                       -           5,057,504                         -            8,950,000
          Operating Transfer In               779,300             818,000             861,000                34,760                60,000                70,000           1,460,000               625,000              235,000
          Total Current Year Revenues      16,067,081     16,826,200     17,750,900        9,829,632        9,679,000        9,931,000        1,536,448        1,625,000        1,645,000         6,680,967           2,625,800       13,485,100
                                              -                        -
          Total Available Resources       23,079,649     25,168,151     26,217,562      13,784,356      14,012,964     14,045,521        4,857,508        5,660,700        5,964,700      27,675,909        26,679,624       25,830,685
         Estimated Expenditures
           Administration (CM,CS,CA)               419,463             570,530             657,480             144,958             170,000             185,200
          Building                  801,409             999,300         1,069,900                                -
          Human Resources               203,559             215,630             248,030
          Development Services               168,679             225,170             291,860
          Economic Dev./Strategic Inn.                         -                 30,000                      -
          Finance/Municipal Court               907,999             992,155         1,059,320
          Library                   865,205         1,039,200         1,175,200
          Rec & Comm Svc               287,369             407,610             700,520
          Parks                     579,228             662,130             947,785
          Police                4,417,806         4,534,200         5,073,500
          Fire / EMS            3,196,643         3,741,320         4,096,490
          Public Works               429,590             656,180             719,780              435,378            617,600            825,420                25,000                  40,000              120,000
          Fleet Services               203,258             291,950             361,650                       -
          Non-Departmental               646,611             742,375             879,415             762,761             760,580             794,980             113,480            198,500            111,980              122,639                         -                         -
          Information Technology               495,879             608,739             683,240                92,524             111,790             126,990                      -
          Billing & Collection                         -                        -                       -              534,874             577,360             615,410                      -
          Water Operations                         -                        -                       -           2,639,706          2,747,220         2,865,830                      -
          Wastewater Operations                         -                        -                       -           2,786,489          3,099,814         3,284,614                      -
          Grant Expenditures                         -                        -                       -                        -
          Operating Transfer/Grant           1,115,000             985,000             265,000          2,304,759          2,416,000         2,355,000               73,500               73,500            194,000
          Sub Total Operating       14,737,698     16,701,489     18,229,170        9,266,071        9,882,764     10,228,024            622,358           889,600        1,131,400            147,639                 40,000             120,000
          Capital Projects/Equip                         -                         -             158,399           451,400        1,331,300         3,506,001        14,227,039       21,733,550
          Debt Service                         -
              Principal Payments                         -                                                63,068                  67,000                 60,500
              Interest Payments                         -
              Fiscal Agent Fees                         -
          Sub Total Debt Service                         -                       -                       -                       -                63,068                 67,000                60,500
          Total Expenditures       14,737,698     16,701,489     18,229,170        9,266,071        9,882,764     10,228,024            780,757        1,341,000        2,462,700         3,716,708        14,334,039       21,914,050
          Change in Fund Balance          1,329,383            124,711          (478,270)            563,561          (203,764)          (297,024)            755,691           284,000         (817,700)         2,964,259      (11,708,239)       (8,428,950)
         Est. Ending Resources         8,341,951  $8,466,662  $7,988,392  $4,518,285  $4,130,200  $3,817,497  $4,076,751  $4,319,700  $3,502,000  $23,959,201  $12,345,585  $3,916,635

        Non-major funds include Economic Development Corporation Sales tax Fund, Crime Control District Sales Tax Fund,
        Library Donation Fund, Street Maintenance Fund, Municipal Court Funds, Traffic Safety Fund and Grant Funds.


                                                                                                           95