
Page 465 - Bedford-FY23-24 Budget
P. 465
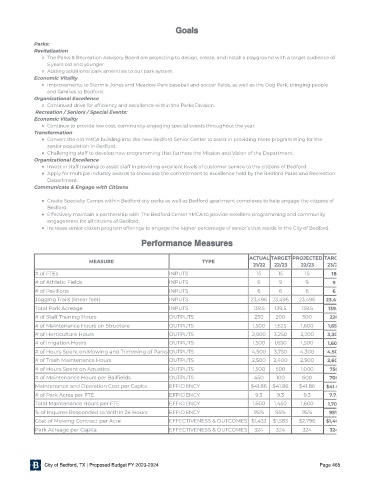
Goals

            Parks:
            Revitalization
                 The Parks & Recreation Advisory Board are projecting to design, create, and install a playground with a target audience of
                 5 years old and younger.
                 Adding additional park amenities to our park system.
            Economic Vitality
                 Improvements to Stormie Jones and Meadow Park baseball and soccer  elds, as well as the Dog Park, bringing people
                 and families to Bedford.

            Organizational Excellence
                 Continued drive for ef ciency and excellence within the Parks Division.
             Recreation / Seniors / Special Events:
            Economic Vitality
                 Continue to provide low cost, community-engaging special events throughout the year.
            Transformation
                 Convert the old YMCA building into the new Bedford Senior Center to assist in providing more programming for the
                 senior population in Bedford.
                 Challenging staff to develop new programming that furthers the Mission and Vision of the Department.
            Organizational Excellence
                 Invest in staff training to assist staff in providing excellent levels of customer service to the citizens of Bedford.
                 Apply for multiple industry awards to showcase the commitment to excellence held by the Bedford Parks and Recreation
                 Department.
            Communicate & Engage with Citizens
                 Create Specialty Camps within Bedford city parks as well as Bedford apartment complexes to help engage the citizens of
                 Bedford.
                 Effectively maintain a partnership with The Bedford Center YMCA to provide excellent programming and community
                 engagement for all citizens of Bedford.
                 Increase senior citizen program offerings to engage the higher percentage of senior’s that reside in the City of Bedford.


                                                Performance Measures


                                                                                   ACTUAL  TARGET  PROJECTED  TARG
                              MEASURE                               TYPE
                                                                                     21/22  22 /23   22 /23  23/2
             # of FTEs                                   INPUTS                       15     15       15       18
             # of Athletic Fields                        INPUTS                       6      9        9
                                                                                                               9
             # of Pavilions                              INPUTS                       6      6        6        6
             Jogging Trails (linear feet)                INPUTS                     23,496  23,496  23,496   23,49
             Total Park Acreage                          INPUTS                      139.5  139.5    139.5    139.
             # of Staff Training Hours                   OUTPUTS                     250    200      300      220
             # of Maintenance Hours on Structure         OUTPUTS                     1,500  1,625    1,600   1,65
             # of Horticulture Hours                     OUTPUTS                    2,900   3,250   3,200    3, 30
             # of Irrigation Hours                       OUTPUTS                     1,500  1,650    1,500
                                                                                                             1,60
             # of Hours Spent on Mowing and Trimming of Parks OUTPUTS               4,500   3,750   4,300    4 ,50
             # of Trash Maintenance Hours                OUTPUTS                    2,500   2,400   2,500    2 ,60
             # of Hours Spent on Aquatics                OUTPUTS                     1,500  500     1,000     750
             # of Maintenance Hours per Ball elds        OUTPUTS                     450    100      600      700
             Maintenance and Operation Cost per Capita   EFFICIENCY                 $41.86  $41.86  $41.86   $ 41. 8
             # of Park Acres per FTE                     EFFICIENCY                   9.3    9.3     9.3      7.75
             Total Maintenance Hours per FTE             EFFICIENCY                  1,600  1,450    1,600   1,70
             % of Inquires Responded to Within 24 Hours  EFFICIENCY                  95%    95%      95%      95%
             Cost of Mowing Contract per Acre            EFFECTIVENESS & OUTCOMES $1,433   $1,583   $2,796   $1,40
             Park Acreage per Capita                     EFFECTIVENESS & OUTCOMES    324    324      324      324


                City of Bedford, TX | Proposed Budget FY 2023-2024                                         Page 465