Page 345 - Bedford-FY23-24 Budget
P. 345

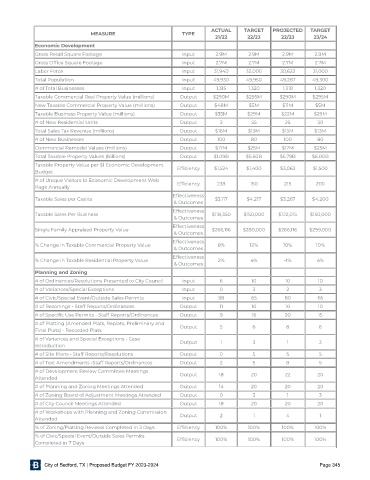
ACTUAL     TARGET   PROJECTED    TARGET
                               MEASURE                       TYPE
                                                                        21/22      22 /23     22 /23     23/24

             Economic Development 
             Gross Retail Square Footage                     Input      2.9M       2.9M       2.9M       2.9M
             Gross Of ce Square Footage                      Input      2.7M       2.7M       2.7M       2.7M
             Labor Force                                     Input      31,940    32,000      30,622     31,000
             Total Population                                Input      49,930    49,950      49,267    49,300
             # of Total Businesses                           Input       1,315     1,320       1,318     1,320
             Taxable Commercial Real Property Value (millions)  Output  $290M     $295M       $290M     $295M
             New Taxable Commercial Property Value (millions)  Output   $48M       $5M        $11M       $5M
             Taxable Business Property Value (millions)     Output      $35M       $29M       $22M       $29M
             # of New Residential Units                     Output        3         55         25         30
             Total Sales Tax Revenue (millions)             Output      $16M       $13M       $13M       $13M
             # of New Businesses                            Output       100        80         100        80
             Commercial Remodel Values (millions)           Output      $17M       $25M       $17M       $25M
             Total Taxable Property Values (billions)       Output      $1.09B    $5.50B      $5.79B    $6.00B
             Taxable Property Value per $1 Economic Development  Ef ciency  $1,524  $1,400    $3,063     $1,500
             Budget
             # of Unique Visitors to Economic Development Web  Ef ciency  238       150        215        200
             Page Annually
                                                          Effectiveness
             Taxable Sales per Capita                                   $3,117     $4,217     $3,267    $4,200
                                                           & Outcomes
                                                          Effectiveness
             Taxable Sales Per Business                                $118,350   $150,000   $122,015   $150,000
                                                           & Outcomes
                                                          Effectiveness
             Single Family Appraised Property Value                    $266,116  $280,000    $266,116  $299,000
                                                           & Outcomes
                                                          Effectiveness
             % Change in Taxable Commercial Property Value               8%         12%        10%        10%
                                                           & Outcomes
                                                          Effectiveness
             % Change in Taxable Residential Property Value              2%         4%         -1%        4%
                                                           & Outcomes

             Planning and Zoning
             # of Ordinances/Resolutions Presented to City Council  Input  6        10         10         10
             # of Variances/Special Exceptions               Input        0          3          2          3
             # of Civic/Special Event/Outside Sales Permits  Input       98         65         80         65
             # of Rezonings - Staff Reports/Ordinances      Output        11        10         10         10
             # of Speci c Use Permits - Staff Reports/Ordinances  Output  9         16         20         15
             # of Platting (Amended Plats, Replats, Preliminary and  Output  5       6          8          6
             Final Plats) - Recorded Plats
             # of Variances and Special Exceptions - Case
             Introduction                                   Output        1          3          1          3
             # of Site Plans - Staff Reports/Resolutions    Output        0          5          5          5
             # of Text Amendments -Staff Reports/Ordinances  Output       2          5          8          5
             # of Development Review Committee Meetings     Output       18         20         22         20
             Attended
             # of Planning and Zoning Meetings Attended     Output       14         20         20         20
             # of Zoning Board of Adjustment Meetings Attended  Output    0          3          1          3
             # of City Council Meetings Attended            Output       18         20         20         20
             # of Workshops with Planning and Zoning Commission
             Attended                                       Output        2          1          4          1
             % of Zoning/Platting Reviews Completed in 3 Days  Ef ciency  100%     100%       100%       100%
             % of Civic/Special Event/Outside Sales Permits  Ef ciency  100%       100%       100%       100%
             Completed in 7 Days


                City of Bedford, TX | Proposed Budget FY 2023-2024                                         Page 345
   340   341   342   343   344   345   346   347   348   349   350