
Page 73 - Watauga FY22-23 Budget
P. 73
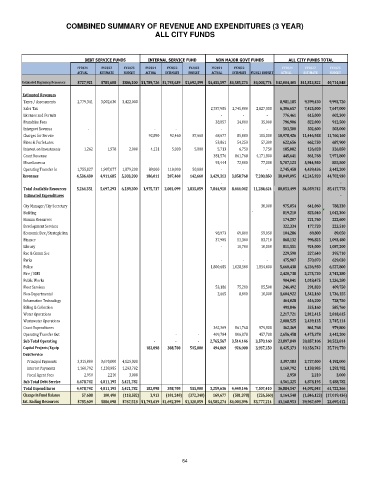
COMBINED SUMMARY OF REVENUE AND EXPENDITURES (3 YEAR)
                                                    ALL CITY FUNDS


                             DEBT SERVICE FUNDS   INTERNAL SERVICE FUND   NON MAJOR GOVT FUNDS  ALL CITY FUNDS TOTAL
                           FY2021          FY2022      FY2023   FY2021          FY2022      FY2023   FY2021          FY2022          FY2021                  FY2022   FY2023
                           ACTUAL  ESTIMATE  BUDGET  ACTUAL  ESTIMATE  BUDGET  ACTUAL  ESTIMATE  FY2023 BUDGET  ACTUAL  ESTIMATE  BUDGET
        Estimated Beginning Resources  $727,921  $785,608  $886,100 $1,789,726 $1,793,639 $1,692,399  $4,415,597 $4,585,274  $4,003,774 $42,004,405 $41,813,822      40,714,848

        Estimated Revenues
         Taxes / Assessments          2,779,341       3,002,630    3,422,000                      8,981,185        9,399,430        9,993,720
         Sales Tax                                                         2,787,985     2,745,000       2,827,000        6,306,657        7,425,000        7,647,000
         Licenses and Permits                                                          -                 -                    -           776,461           615,000           602,300
         Franchise Fees                                                         38,057          34,000            35,000           796,906           822,000           912,500
         Intergovt Revenue                     -                 -                 -                   -                 -                    -           503,500           502,600           503,000
         Charges for Service                             92,890         92,460           87,660           68,677          85,000          105,000     10,978,426      11,446,958      11,760,160
         Fines & Forfeitures                                                    53,861          54,250            57,300           622,656           662,750           687,900
         Interest on Investments                 1,262              1,978            2,000            4,121            5,000             5,000              5,713            6,750               7,750           185,082           126,028           326,850
         Grant Revenue                                                        381,576        861,768       4,171,800           445,641           861,768        7,971,800
         Miscellaneous                                                          93,444          72,000            77,000        5,707,123        5,944,950           855,500
         Operating Transfer In          1,755,827       1,907,077    1,879,200          89,000       110,000           50,000                  -                 -                    -        2,745,458        4,439,436        3,442,200
         Total Current Year
        Revenues               4,536,430       4,911,685    5,303,200        186,011       207,460         142,660      3,429,313     3,858,768       7,280,850     38,049,095      42,245,920      44,702,930
                                                                                       -                                       -
         Total Available Resources         5,264,351       5,697,293    6,189,300     1,975,737    2,001,099      1,835,059      7,844,910     8,444,042     11,284,624     80,053,499      84,059,742      85,417,778
         Estimated Expenditures                                                                                                -
         City Manager/City Secretary                                                           30,000           975,054           641,060           788,330
         Building                                                                   `                819,210           823,040        1,042,300
         Human Resources                                                                             174,207           221,760           222,600
         Development Services                                                                        322,334           177,720           223,510
         Economic Dev./Strategic Inn.                                           98,973          69,800            59,050           104,286             69,800              89,050
         Finance                                                                37,905          53,300            83,710           868,132           996,825        1,093,480
         Library                                                                       -           10,700            10,000           811,551           924,000        1,087,200
         Rec & Comm Svc                                                                              229,590           327,640           395,710
         Parks                                                                         -                 -                    -           475,907           570,070           629,030
         Police                                                            1,800,685     1,628,500       1,854,400        5,660,438        6,236,950        6,527,800
         Fire / EMS                                                                               2,420,738        3,275,730        3,742,380
         Public Works                                                                                904,041        1,018,475        1,236,280
         Fleet Services                                                         53,186          75,200            85,500           246,492           291,820           409,750
         Non-Departmental                                                          2,665            8,000            10,000        1,604,922        1,542,160        1,736,155
         Information Technology                                                                      464,028           616,200           728,750
         Billing & Collection                                                                        491,846           535,160           585,760
         Water Operations                                                                         2,217,721        2,812,415        2,818,615
         Wastewater Operations                                                                    2,088,525        2,439,135        2,745,114
         Grant Expenditures                                                   362,369        861,768          979,800           362,369           861,768           979,800
         Operating Transfer Out                                       -                  -          409,784        806,878          457,700        2,656,458        4,475,378        3,442,200
         Sub Total Operating                                   -                -                  -      2,765,567     3,514,146       3,570,160     23,897,849      28,857,106      30,523,814
         Capital Projects/Equip                       182,098       308,700         515,000         494,069        926,000       3,937,250        8,425,373      10,356,742      25,719,770
         Debt Service
             Principal Payments          3,315,000       3,670,000    4,125,000                   3,397,583        3,737,000        4,192,000
             Interest Payments          1,160,792       1,138,985    1,293,782                    1,160,792        1,138,985        1,293,782
             Fiscal Agent Fees                 2,950              2,210            3,000                 2,950                2,210                3,000
         Sub Total Debt Service         4,478,742       4,811,195    5,421,782                    4,561,325        4,878,195        5,488,782
         Total Expenditures         4,478,742       4,811,195    5,421,782        182,098       308,700         515,000      3,259,636     4,440,146       7,507,410     36,884,547      44,092,043      61,722,366

         Change in Fund Balance              57,688          100,490      (118,582)           3,913      (101,240)      (372,340)        169,677      (581,378)        (226,560)       1,164,548      (1,846,123) (17,019,436)
        Est. Ending Resources  $785,609  $886,098  $767,518 $1,793,639 $1,692,399 $1,320,059  $4,585,274 $4,003,896  $3,777,214     43,168,953      39,967,699      23,695,412


                                                             64