
Page 448 - Microsoft Word - FY 2021 tax info sheet
P. 448
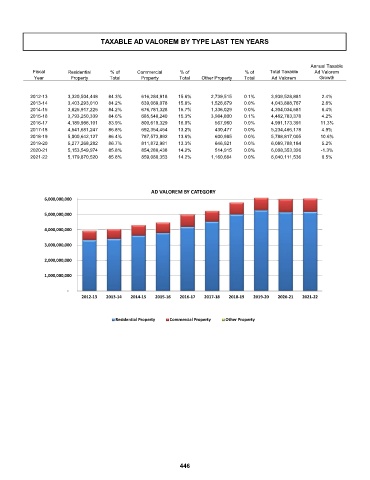
TAXABLE AD VALOREM BY TYPE LAST TEN YEARS


                                                                                                        Annual Taxable
            Fiscal     Residential    % of    Commercial     % of                 % of    Total Taxable  Ad Valorem
            Year        Property     Total      Property    Total   Other Property  Total  Ad Valorem      Growth

           2012-13         3,320,504,448  84.3%         616,284,918  15.6%         2,739,515  0.1%     3,939,528,881  2.4%
           2013-14         3,403,293,010  84.2%         639,069,078  15.8%         1,526,679  0.0%     4,043,888,767  2.6%
           2014-15         3,625,917,225  84.2%         676,781,328  15.7%         1,336,029  0.0%     4,304,034,581  6.4%
           2015-16         3,793,250,339  84.6%         685,548,240  15.3%         3,984,800  0.1%     4,482,783,378  4.2%
           2016-17         4,189,986,101  83.9%         800,619,329  16.0%            567,960  0.0%     4,991,173,391  11.3%
           2017-18         4,541,681,247  86.8%         692,354,454  13.2%            430,477  0.0%     5,234,466,178  4.9%
           2018-19         5,000,642,127  86.4%         787,573,892  13.6%            600,985  0.0%     5,788,817,005  10.6%
           2019-20         5,277,268,282  86.7%         811,872,981  13.3%            646,921  0.0%     6,089,788,184  5.2%
           2020-21         5,153,549,974  85.8%         854,288,438  14.2%            514,915  0.0%     6,008,353,326  -1.3%
           2021-22         5,179,870,520  85.8%         859,080,353  14.2%         1,160,664  0.0%     6,040,111,536  0.5%


                                                   AD VALOREM BY CATEGORY
                 6,000,000,000

                 5,000,000,000

                 4,000,000,000

                 3,000,000,000

                 2,000,000,000

                 1,000,000,000


                         ‐
                            2012‐13  2013‐14  2014‐15  2015‐16  2016‐17  2017‐18  2018‐19  2019‐20  2020‐21  2021‐22


                                       Residential Property  Commercial Property  Other Property


                                                             446