Page 46 - Forest Hill FY22 Annual Budget
P. 46

l
        Fore�Hil

        L
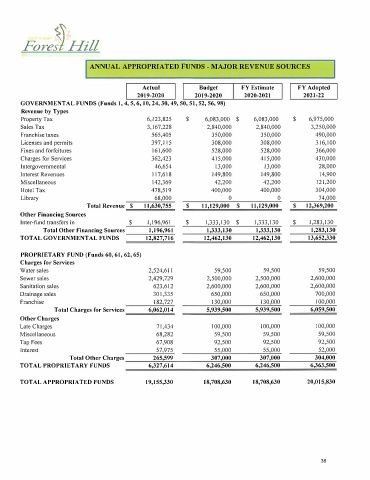
                              ANNUAL APPROPRIATED FUNDS - MAJOR REVENUE SOURCES


                                                Actual             Budget       FY Estimate        FY Adopted
                                              2019-2020          2019-2020       2020-2021           2021-22
        GOVERNMENTAL FUNDS (Funds I, 4, 5, 6, 10, 24, 30, 49, 50, 51, 52, 56, 98)
        Revenue by Types
        Property Tax                             6,123,825    $     6,083,000  $     6,083,000    $    6,975,000
        Sales Tax                                3,167,228           2,840,000       2,840,000         3,250,000
        Franchise taxes                            565,405             350,000         350,000           490,000
        Licenses and permits                       397,115             308,000         308,000           316,100
        Fines and forfeitures                      161,600             528,000         528,000           366,000
        Charges for Services                       362,423             415,000         415,000           430,000
        Intergovernmental                           46,654              13,000          13,000            28,000
        Interest Revenues                          117,618             149,800         149,800            14,900
        Miscellaneous                              142,369              42,200          42,200           121,200
        Hotel Tax                                  478,519             400,000         400,000           304,000
        Library                                     68,000                  0               0             74,000
                              Total Revenue  $   11,630,755   $    11,129,000  $    I 1,129,000   $   12,369,200
        Other Financing Sources
        Inter-fund transfers in             $    1,196,961    $     1,333,130  $    1,333,130    $     1,283,130
               Total Other Financing Sources      1,196,961          1,333,130       1,333,130         1,283,130
        TOTAL GOVERNMENTAL FUNDS                 12,827,716         12,462,130      12,462,130        13,652,330

        PROPRIETARY FUND (Funds 60, 61, 62, 65)
        Charges for Services
        Water sales                               2,524,611             59,500          59,500            59,500
        Sewer sales                               2,429,729          2,500,000       2,500,000         2,600,000
        Sanitation sales                           623,612           2,600,000       2,600,000         2,600,000
        Drainage sales                             301,335            650,000          650,000           700,000
        Franchise                                  182,727            130,000          130,000           100,000
                   Total Charges for Services     6,062,014          5,939,500       5,939,500         6,059,500
        Other Charges
        Late Charges                                71,434            100,000          100,000           100,000
        Miscellaneous                               68,282             59,500           59,500            59,500
        Tap Fees                                    67,908              92,500          92,500            92,500
        Interest                                    57,975             55,000           55,000            52,000
                        Total Other Charges        265,599             307,000         307,000           304,000
        TOTAL PROPRIETARY FUNDS                   6,327,614          6,246,500       6,246,500         6,363,500


        TOT AL APPROPRIATED FUNDS                19,155,330         18,708,630      18,708,630        20,015,830


                                                                                                           38
   41   42   43   44   45   46   47   48   49   50   51