
Page 298 - Watauga FY21 Budget
P. 298
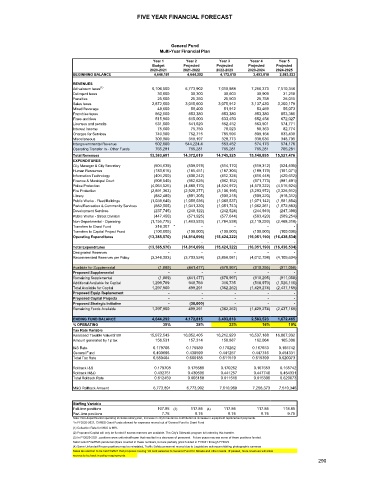
FIVE YEAR FINANCIAL FORECAST
General Fund
Multi-Year Financial Plan
Year 1 Year 2 Year 3 Yeasr 4 Year 5
Budget Projected Projected Projected Projected
2020-2021 2021-2022 2022-2023 2023-2024 2024-2025
BEGINNING BALANCE 4,646,181 4,644,292 4,172,815 3,493,818 2,583,523
REVENUES
Ad valorem taxes (1) 6,106,500 6,773,902 7,010,988 7,256,373 7,510,346
Delinqent taxes 30,000 30,300 30,603 30,909 31,218
Penalties 25,000 25,250 25,503 25,758 26,015
Sales taxes 2,872,000 3,015,600 3,075,912 3,137,430 3,200,179
Mixed Beverage 48,000 50,400 51,912 53,469 55,073
Franchise taxes 862,000 853,380 853,380 853,380 853,380
Fines and fees 515,900 615,000 633,450 652,454 672,027
Licenses and permits 531,000 541,620 552,452 563,501 574,771
Interest Income 75,000 75,750 78,023 80,363 82,774
Charges for Services 740,500 762,715 785,596 809,164 833,439
Miscellaneous 309,900 319,197 328,773 338,636 348,795
Intergovernmental Revenue 502,600 544,224.4 553,452 574,176 574,176
Operating Transfer In - Other Funds 765,281 765,281 765,281 765,281 765,281
Total Revenues 13,383,681 14,372,619 14,745,325 15,140,895 15,527,476
EXPENDITURES
City Manager & City Secretary (504,039) (509,079) (514,170) (519,312) (524,505)
Human Resources (183,615) (185,451) (187,306) (189,179) (191,071)
Information Technology (404,200) (408,242) (412,324) (416,448) (420,612)
Finance & Municipal Court (908,540) (952,625) (962,152) (971,773) (981,491)
Police Protection (4,064,525) (4,480,170) (4,524,972) (4,570,222) (4,515,924)
Fire Protection (2,891,363) (2,920,277) (3,106,195) (3,293,972) (3,326,912)
Library (882,480) (891,305) (900,218) (909,220) (918,312)
Public Works - Fleet/Buildings (1,039,640) (1,050,036) (1,060,537) (1,071,142) (1,081,854)
Parks/Recreation & Community Services (882,505) (1,041,330) (1,051,743) (1,062,261) (1,072,883)
Development Services (237,745) (240,122) (242,524) (244,949) (247,398)
Public Works - Street Division (447,450) (571,925) (577,644) (583,420) (589,254)
Non-Departmental - Operating (1,155,775) (1,463,533) (1,784,538) (2,119,293) (2,468,318)
Transfers to Grant Fund 316,307 * - - - -
Transfers to Capital Project Fund (100,000) (100,000) (100,000) (100,000) (100,000)
Operating Expenditures (13,385,570) (14,814,096) (15,424,322) (16,051,190) (16,438,534)
- - - - -
Total Expenditures (13,385,570) (14,814,096) (15,424,322) (16,051,190) (16,438,534)
Designated Reserves - - - - -
Recommended Reserves per Policy (3,346,393) (3,703,524) (3,856,081) (4,012,798) (4,109,634)
Available for Supplemental (1,889) (441,477) (678,997) (910,295) (911,058)
Proposed Supplemental - - - - -
Remaining Supplemental (1,889) (441,477) (678,997) (910,295) (911,058)
Additional Available for Capital 1,299,789 940,768 316,735 (518,979) (1,526,110)
Total Available for Capital 1,297,900 499,291 (362,262) (1,429,274) (2,437,169)
Proposed Equip Replacement - - - - -
Proposed Capital Projects - - - - -
Proposed Strategic Initiative - (30,000) - - -
Remaining Funds Available 1,297,900 499,291 (362,262) (1,429,274) (2,437,169)
ENDING FUND BALANCE 4,644,292 4,172,815 3,493,818 2,583,523 1,672,465
% OPERATING 35% 28% 23% 16% 10%
Tax Rate Variable
Assessed Taxable Value/$100 15,972,543 16,052,405 16,212,929 16,537,188 16,867,932
Amount generated by 1¢ tax 156,531 157,314 158,887 162,064 165,306
I&S Rate 0.179708 0.175589 0.170262 0.167653 0.165742
General Fund 0.400696 0.430599 0.441257 0.447746 0.454331
Total Tax Rate 0.580404 0.606188 0.611519 0.615399 0.620073
Rollback I&S 0.179708 0.175589 0.170262 0.167653 0.165742
Rollback M&O 0.432751 0.430599 0.441257 0.447746 0.454331
Total Rollback Rate 0.612459 0.606188 0.611519 0.615399 0.620073
M&O Rollback Amount 6,773,891 6,773,902 7,010,988 7,256,373 7,510,346
Staffing Variable
Full-time positions 107.85 (3) 117.85 (4) 117.85 117.85 118.85
Part-time positions 7.75 9.75 9.75 9.75 9.75
Note: Non-departmental operating includes salary plan, Increase in city's insurance contribution & increase in equipment replacement payments.
*In FY2020-2021, CARES Grant Funds allowed for expenses moved out of General Fund to Grant Fund
(1) Collection Rate for M&O is 98%
(2) Proposed Capital will only be funded if excess reserves are available. The City's Sidewalk program is funded by this transfer.
(3) In FY2020-2021, positions were unfunded/frozen that resulted in a decrease of personnel. Future years may see some of these positions funded.
Safer Grant Fire/EMS personnel (6)are counted in these numbers, but are partially grant funded in FY2021 through FY2023
(4) Some Unfunded/Frozen positions may be reinstated, Traffic Safety personnel moved due to Legislature actions prohibiting photographic cameras
Sales tax election to be held 5/2021 that proposes moving 1/4 cent sales tax to General Fund for Streets and other needs. If passed, more revenues will allow
reerves to be back in policy requirements.
290