
Page 41 - N. Richland Hills General Budget
P. 41
BUDGET OVERVIEW
FY 2019/2020 REVISED & FY 2020/2021 ADOPTED BUDGET
HIGHLIGHTS
As part of the regular annual budget process, some areas of the FY 2019/2020 budget
require revision from the originally adopted level. Projecting revenues and expenditures can be
difficult because they are being predicted up to fourteen months before they occur. Revenues
and expenditures are tracked throughout the year and adjustments are made to the Adopted
Budget in order to complete the fiscal year.
General Fund FY 2019/2020 Revised Budget
Revenue Overview
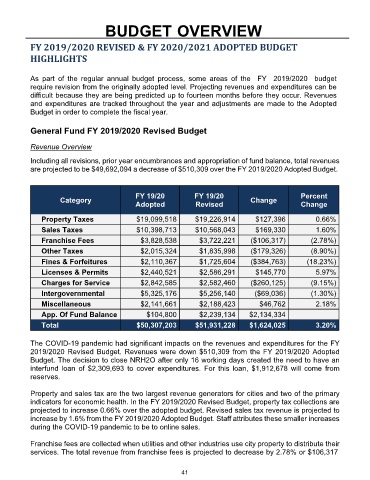
Including all revisions, prior year encumbrances and appropriation of fund balance, total revenues
are projected to be $49,692,094 a decrease of $510,309 over the FY 2019/2020 Adopted Budget.
FY 19/20 FY 19/20 Percent
Category Change
Adopted Revised Change
Property Taxes $19,099,518 $19,226,914 $127,396 0.66%
Sales Taxes $10,398,713 $10,568,043 $169,330 1.60%
Franchise Fees $3,828,538 $3,722,221 ($106,317) (2.78%)
Other Taxes $2,015,324 $1,835,998 ($179,326) (8.90%)
Fines & Forfeitures $2,110,367 $1,725,604 ($384,763) (18.23%)
Licenses & Permits $2,440,521 $2,586,291 $145,770 5.97%
Charges for Service $2,842,585 $2,582,460 ($260,125) (9.15%)
Intergovernmental $5,325,176 $5,256,140 ($69,036) (1.30%)
Miscellaneous $2,141,661 $2,188,423 $46,762 2.18%
App. Of Fund Balance $104,800 $2,239,134 $2,134,334
Total $50,307,203 $51,931,228 $1,624,025 3.20%
The COVID-19 pandemic had significant impacts on the revenues and expenditures for the FY
2019/2020 Revised Budget. Revenues were down $510,309 from the FY 2019/2020 Adopted
Budget. The decision to close NRH2O after only 16 working days created the need to have an
interfund loan of $2,309,693 to cover expenditures. For this loan, $1,912,678 will come from
reserves.
Property and sales tax are the two largest revenue generators for cities and two of the primary
indicators for economic health. In the FY 2019/2020 Revised Budget, property tax collections are
projected to increase 0.66% over the adopted budget. Revised sales tax revenue is projected to
increase by 1.6% from the FY 2019/2020 Adopted Budget. Staff attributes these smaller increases
during the COVID-19 pandemic to be to online sales.
Franchise fees are collected when utilities and other industries use city property to distribute their
services. The total revenue from franchise fees is projected to decrease by 2.78% or $106,317
41