
Page 219 - N. Richland Hills General Budget
P. 219
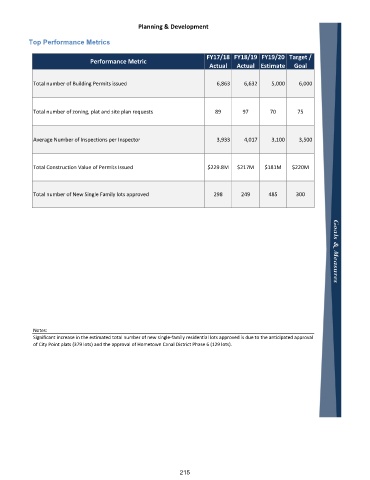
Planning & Development

           Top Performance Metrics

                                                                     FY17/18  FY18/19  FY19/20  Target /
                               Performance Metric
                                                                      Actual   Actual Estimate    Goal


            Total number of Building Permits issued                          6,863          6,632          5,000          6,000


            Total number of zoning, plat and site plan requests         89       97       70       75


            Average Number of Inspections per Inspector                      3,933          4,017          3,100          3,500


            Total Construction Value of Permits Issued                $229.8M   $217M    $181M    $220M


            Total number of New Single Family lots approved             298      249      485      300


            Notes:
            Significant increase in the estimated total number of new single‐family residential lots approved is due to the anticipated approval
            of City Point plats (379 lots) and the approval of Hometown Canal District Phase 6 (129 lots).


                                                             215