
Page 224 - N. Richland Hills General Budget
P. 224
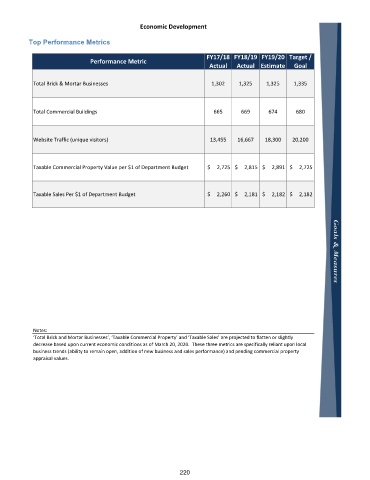
Economic Development

           Top Performance Metrics

                                                                     FY17/18  FY18/19  FY19/20  Target /
                               Performance Metric
                                                                      Actual   Actual Estimate    Goal


            Total Brick & Mortar Businesses                            1,302    1,325    1,325    1,335


            Total Commercial Buildings                                  665      669      674      680


            Website Traffic (unique visitors)                          13,455   16,667   18,300   20,200


            Taxable Commercial Property Value per $1 of Department Budget   $     2,725  $     2,815  $     2,891  $     2,725


            Taxable Sales Per $1 of Department Budget                 $     2,260  $     2,181  $     2,182  $     2,182


            Notes:
            ‘Total Brick and Mortar Businesses’, ‘Taxable Commercial Property’ and ‘Taxable Sales’ are projected to flatten or slightly
            decrease based upon current economic conditions as of March 20, 2020.  These three metrics are specifically reliant upon local
            business trends (ability to remain open, addition of new business and sales performance) and pending commercial property
            appraisal values.


                                                             220