
Page 58 - Manfield FY21 Budget
P. 58
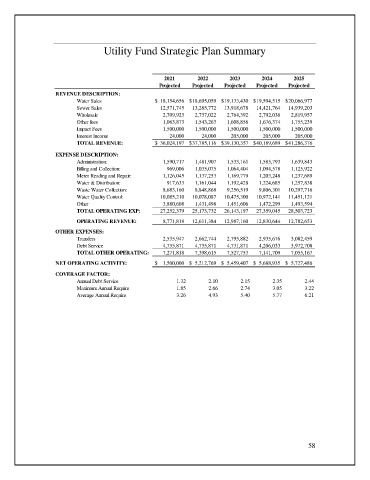
Utility Fund Strategic Plan Summary


                                                       2021       2022       2023       2024      2025
                                                      Projected  Projected  Projected  Projected  Projected
                   REVENUE DESCRIPTION:
                          Water Sales               $    18,154,656 $  18,695,059 $  19,133,430 $  19,594,515 $  20,066,977
                          Sewer Sales                     12,571,745     13,285,772     13,918,678     14,421,764     14,939,203
                          Wholesale                         2,709,923       2,737,022       2,764,392       2,792,036       2,819,957
                          Other fees                        1,063,873       1,543,263       1,608,856       1,676,374       1,755,239
                          Impact Fees                       1,500,000       1,500,000       1,500,000       1,500,000       1,500,000
                          Interest Income                        24,000            24,000          205,000          205,000          205,000
                          TOTAL REVENUE:            $    36,024,197 $  37,785,116 $  39,130,357 $  40,189,689 $  41,286,376
                   EXPENSE DESCRIPTION:
                          Administration:                   1,590,717       1,481,907       1,533,161       1,585,793       1,639,843
                          Billing and Collection:              969,006       1,035,075       1,064,404       1,094,578       1,125,922
                          Meter Reading and Repair:          1,126,045       1,137,253       1,169,779       1,203,248       1,237,689
                          Water & Distribution:                917,633       1,161,044       1,192,428       1,224,685       1,257,838
                          Waste Water Collection:           8,683,160       8,848,868       9,256,519       9,806,301     10,297,716
                          Water Quality Control:          10,085,210     10,078,087     10,475,300     10,972,141     11,451,121
                          Other                             3,880,608       1,431,498       1,451,606       1,472,299       1,493,594
                          TOTAL OPERATING EXP:            27,252,379     25,173,732     26,143,197     27,359,045     28,503,723
                          OPERATING REVENUE:                8,771,818     12,611,384     12,987,160     12,830,644     12,782,653
                   OTHER EXPENSES:
                          Transfers                         2,535,947       2,662,744       2,795,882       2,935,676       3,082,459
                          Debt Service                      4,735,871       4,735,871       4,731,871       4,206,033       3,972,708
                          TOTAL OTHER OPERATING:            7,271,818       7,398,615       7,527,753       7,141,709       7,055,167

                   NET OPERATING ACTIVITY:          $      1,500,000 $    5,212,769 $    5,459,407 $    5,688,935 $    5,727,486
                   COVERAGE FACTOR:
                          Annual Debt Service              1.32       2.10       2.15      2.35       2.44
                          Maximum Annual Require           1.85       2.66       2.74      3.05       3.22
                          Average Annual Require           3.26       4.93       5.40      5.77       6.21


                                                                                                       58