
Page 59 - Manfield FY21 Budget
P. 59
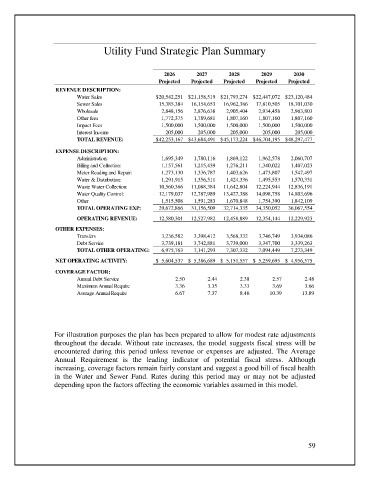
Utility Fund Strategic Plan Summary


                                                       2026       2027       2028      2029       2030
                                                      Projected  Projected  Projected  Projected  Projected
                   REVENUE DESCRIPTION:
                          Water Sales                $  20,542,251 $  21,158,519 $  21,793,274 $  22,447,072 $  23,120,484
                          Sewer Sales                    15,385,384     16,154,653     16,962,386     17,810,505     18,701,030
                          Wholesale                        2,848,156       2,876,638       2,905,404       2,934,458       2,963,803
                          Other fees                       1,772,375       1,789,681       1,807,160       1,807,160       1,807,160
                          Impact Fees                      1,500,000       1,500,000       1,500,000       1,500,000       1,500,000
                          Interest Income                     205,000          205,000          205,000          205,000          205,000
                          TOTAL REVENUE:             $  42,253,167 $  43,684,491 $  45,173,224 $  46,704,195 $  48,297,477
                   EXPENSE DESCRIPTION:
                          Administration:                  1,695,349       1,780,116       1,869,122       1,962,578       2,060,707
                          Billing and Collection:          1,157,561       1,215,439       1,276,211       1,340,022       1,407,023
                          Meter Reading and Repair:        1,273,130       1,336,787       1,403,626       1,473,807       1,547,497
                          Water & Distribution:            1,291,915       1,356,511       1,424,336       1,495,553       1,570,331
                          Waste Water Collection:        10,560,366     11,088,384     11,642,804     12,224,944     12,836,191
                          Water Quality Control:         12,179,037     12,787,989     13,427,388     14,098,758     14,803,696
                          Other                            1,515,508       1,591,283       1,670,848       1,754,390       1,842,109
                          TOTAL OPERATING EXP:           29,672,866     31,156,509     32,714,335     34,350,052     36,067,554
                          OPERATING REVENUE:             12,580,301     12,527,982     12,458,889     12,354,144     12,229,923
                   OTHER EXPENSES:
                          Transfers                        3,236,582       3,398,412       3,568,332       3,746,749       3,934,086
                          Debt Service                     3,739,181       3,742,881       3,739,000       3,347,700       3,339,263
                          TOTAL OTHER OPERATING:           6,975,763       7,141,293       7,307,332       7,094,449       7,273,349
                   NET OPERATING ACTIVITY:           $    5,604,537 $    5,386,689 $    5,151,557 $    5,259,695 $    4,956,575
                   COVERAGE FACTOR:
                          Annual Debt Service              2.50       2.44      2.38       2.57       2.48
                          Maximum Annual Require           3.36       3.35      3.33       3.69       3.66
                          Average Annual Require           6.67       7.37      8.46      10.39      13.89


                   For illustration purposes the plan has been prepared to allow for modest rate adjustments
                   throughout the decade. Without rate increases, the model suggests fiscal stress will be
                   encountered during this  period unless revenue or expenses are  adjusted. The Average
                   Annual Requirement is the leading indicator of potential fiscal stress. Although
                   increasing, coverage factors remain fairly constant and suggest a good bill of fiscal health
                   in  the Water  and Sewer Fund.  Rates during this period may  or may  not be adjusted
                   depending upon the factors affecting the economic variables assumed in this model.


                                                                                                       59