
Page 288 - Manfield FY21 Budget
P. 288
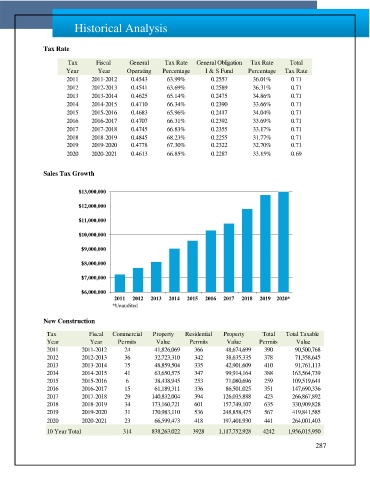
Historical Analysis


               Tax Rate

                       Tax       Fiscal     General     Tax Rate  General Obligation  Tax Rate   Total
                       Year      Year      Operating   Percentage    I & S Fund    Percentage  Tax Rate
                       2011    2011-2012    0.4543      63.99%         0.2557        36.01%      0.71
                       2012    2012-2013    0.4541      63.69%         0.2589        36.31%      0.71
                       2013    2013-2014    0.4625      65.14%         0.2475        34.86%      0.71
                       2014    2014-2015    0.4710      66.34%         0.2390        33.66%      0.71
                       2015    2015-2016    0.4683      65.96%         0.2417        34.04%      0.71
                       2016    2016-2017    0.4707      66.31%         0.2392        33.69%      0.71
                       2017    2017-2018    0.4745      66.83%         0.2355        33.17%      0.71
                       2018    2018-2019    0.4845      68.23%         0.2255        31.77%      0.71
                       2019    2019-2020    0.4778      67.30%         0.2322        32.70%      0.71
                       2020    2020-2021    0.4613      66.85%         0.2287        33.15%      0.69


               Sales Tax Growth


                           $13,000,000

                           $12,000,000

                           $11,000,000

                           $10,000,000
                            $9,000,000


                            $8,000,000
                            $7,000,000

                            $6,000,000
                                       2011  2012  2013  2014  2015  2016  2017  2018  2019  2020*
                                            *Unaudited

               New Construction

                 Tax           Fiscal  Commercial   Property  Residential  Property     Total   Total Taxable
                 Year          Year     Permits      Value      Permits     Value      Permits     Value
                 2011       2011-2012     24           41,826,069  366          48,674,699  390         90,500,768

                 2012       2012-2013     36           32,723,310  342          38,635,335  378         71,358,645

                 2013       2013-2014     75           48,859,504  335          42,901,609  410         91,761,113


                 2014       2014-2015     41           63,650,575  347          99,914,164  388       163,564,739
                 2015       2015-2016      6             38,438,945  253         71,080,696  259       109,519,641

                 2016       2016-2017     15           61,189,311  336          86,501,025  351       147,690,336
                 2017       2017-2018     29          140,832,004  394        126,035,888  423       266,867,892
                 2018       2018-2019     34          173,160,721  601        157,749,107  635       330,909,828
                 2019       2019-2020     31          170,983,110  536        248,858,475  567       419,841,585
                 2020       2020-2021     23           66,599,473  418        197,401,930  441       264,001,403

                 10 Year Total            314           838,263,022  3928     1,117,752,928  4242     1,956,015,950

                                                                                                         287