
Page 268 - Manfield FY21 Budget
P. 268
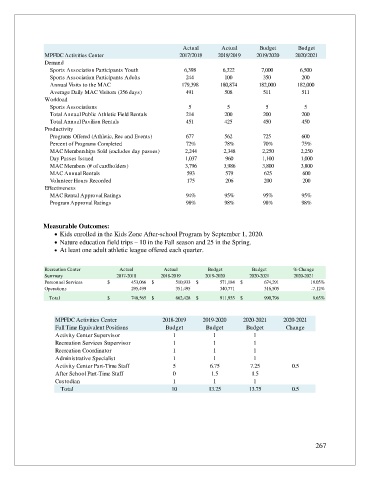
Actual      Actual       Budget       Budget
                MPFDC Activities Center                     2017/2018    2018/2019    2019/2020    2020/2021
                Demand
                  Sports Association Participants Youth       6,398        6,322       7,000        6,500
                  Sports Association Participants Adults       244         100          350          200
                  Annual Visits to the MAC                   179,398      180,874      182,000     182,000
                  Average Daily MAC Visitors (356 days)        491         508          511          511
                Workload
                  Sports Associations                          5            5            5            5
                  Total Annual Public Athletic Field Rentals   214         200          200          200
                  Total Annual Pavilion Rentals                451         425          450          450
                Productivity
                  Programs Offered (Athletic, Rec and Events)  677         562          725          600
                  Percent of Programs Completed                72%         78%          70%          75%
                  MAC Memberships Sold (excludes day passes)  2,244        2,348        2,250        2,250
                  Day Passes Issued                           1,037         960         1,100        1,000
                  MAC Members (# of cardholders)              3,796        3,986        3,800        3,800
                  MAC Annual Rentals                           593          579         625          600
                  Volunteer Hours Recorded                     175          206         200          200
                Effectiveness
                  MAC Rental Approval Ratings                  94%         95%          95%          95%
                  Program Approval Ratings                     98%         98%          98%          98%


               Measurable Outcomes:
                   • Kids enrolled in the Kids Zone After-school Program by September 1, 2020.
                   • Nature education field trips – 10 in the Fall season and 25 in the Spring.
                   •  At least one adult athletic league offered each quarter.

                Recreation Center        Actual        Actual         Budget        Budget        % Change
                Summary                 2017-2018     2018-2019      2019-2020      2020-2021     2020-2021

                Personnel Services   $                    453,066  $                      510,933  $                      571,184  $                    674,291  18.05%


                Operations                                 295,499                          351,495                        340,771                          316,505  -7.12%


                 Total               $                      748,565  $                      862,428  $                      911,955  $                    990,796  8.65%


                   MPFDC Activities Center             2018-2019    2019-2020    2020-2021     2020-2021
                   Full Time Equivalent Positions       Budget       Budget       Budget        Change
                   Activity Center Supervisor             1             1            1
                   Recreation Services Supervisor         1             1            1
                   Recreation Coordinator                 1             1            1
                   Administrative Specialist              1             1            1
                   Activity Center Part-Time Staff        5            6.75         7.25          0.5
                   After School Part-Time Staff           0            1.5          1.5
                   Custodian                              1             1            1
                     Total                                10          13.25        13.75          0.5


                                                                                                         267