
Page 265 - Manfield FY21 Budget
P. 265
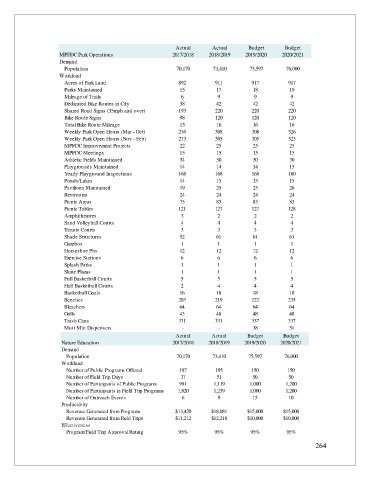
Actual      Actual      Budget      Budget
                     MPFDC Park Operations                2017/2018   2018/2019   2019/2020   2020/2021
                     Demand
                      Population                           70,170       73,410      75,597      76,000
                     Workload
                      Acres of Park Land                    892         911         917         917
                      Parks Maintained                      15           17          18          19
                      Mileage of Trails                      6           9           9           9
                      Dedicated Bike Routes in City         38           42          42          42
                      Shared Road Signs (35mph and over)    193         220         220         220
                      Bike Route Signs                      98          120         120         120
                      Total Bike Route Mileage              13           16          16          16
                      Weekly Park Open Hours (Mar - Oct)    276         308         308         326
                      Weekly Park Open Hours (Nov - Feb)    273         305         305         323
                      MPFDC Improvement Projects            22           25          25          25
                      MPFDC Meetings                        15           15          15          15
                      Athletic Fields Maintained            34           30          30          30
                      Playgrounds Maintained                14           14          14          15
                      Yearly Playground Inspections         168         168         168         180
                      Ponds/Lakes                           14           15          15          15
                      Pavilions Maintained                  19           25          25          26
                      Restrooms                             24           24          24          24
                      Picnic Areas                          75           83          83          83
                      Picnic Tables                         121         127         127         128
                      Amphitheatres                          3           2           2           2
                      Sand Volleyball Courts                 4           4           4           4
                      Tennis Courts                          3           3           3           3
                      Shade Structures                      52           61          61          61
                      Gazebos                                1           1           1           1
                      Horseshoe Pits                        12           12          12          12
                      Exercise Stations                      6           6           6           6
                      Splash Parks                           1           1           1           1
                      Skate Plazas                           1           1           1           1
                      Full Basketball Courts                 5           5           5           5
                      Half Basketball Courts                 2           4           4           4
                      Basketball Goals                      16           18          18          18
                      Benches                               203         219         222         235
                      Bleachers                             64           64          64          64
                      Grills                                43           48          48          48
                      Trash Cans                            331         331         337         337
                      Mutt Mitt Dispensers                   -           -           38          51
                                                           Actual      Actual      Budget      Budget
                     Nature Education                     2017/2018   2018/2019   2019/2020   2020/2021
                     Demand
                       Population                          70,170      73,410      75,597      76,000
                     Workload
                       Number of Public Programs Offered    187         195         150         150
                       Number of Field Trip Days             37          51          50         50
                       Number of Participants of Public Programs  981   1,119       1,000       1,200
                       Number of Participants in Field Trip Programs  1,820  1,239  1,000       1,200
                       Number of Outreach Events             6           9           15         10
                     Productivity
                       Revenue Generated from Programs     $13,420     $18,081     $15,000     $15,000
                       Revenue Generated from Field Trips  $11,212     $12,218     $10,000     $10,000
                     Effectiveness
                       Program/Field Trip Approval Rating   95%         95%         95%         95%

                                                                                                         264