
Page 193 - Manfield FY21 Budget
P. 193
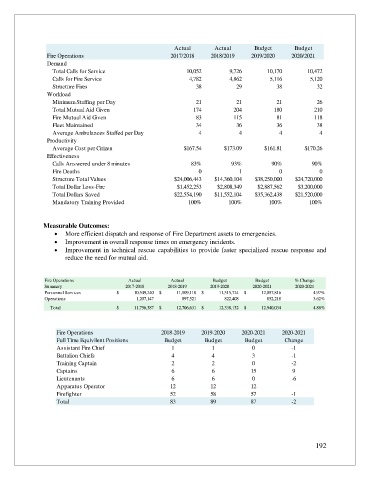
Actual       Actual       Budget        Budget
                 Fire Operations                         2017/2018     2018/2019    2019/2020    2020/2021
                 Demand
                  Total Calls for Service                      10,052        9,726       10,170        10,472
                  Calls for Fire Service                        4,782        4,862        5,116         5,120
                  Structure Fires                                 38           29            38           32
                 Workload
                  Minimum Staffing per Day                        21           21            21           26
                  Total Mutual Aid Given                         174          204           180          210
                  Fire Mutual Aid Given                           83          115            81          118
                  Fleet Maintained                                34           36            36           38
                  Average Ambulances Staffed per Day               4            4            4             4
                 Productivity
                  Average Cost per Citizen                    $167.54      $173.09      $161.81       $170.26
                 Effectiveness
                  Calls Answered under 8 minutes                83%           93%          90%          90%
                  Fire Deaths                                      0            1            0             0
                  Structure Total Values                   $24,006,443  $14,360,104  $38,250,000   $24,720,000
                  Total Dollar Loss-Fire                    $1,452,253   $2,808,349   $2,887,562    $3,200,000
                  Total Dollars Saved                      $22,554,190  $11,552,104  $35,362,438   $21,520,000
                  Mandatory Training Provided                  100%          100%         100%         100%


               Measurable Outcomes:
                   •  More efficient dispatch and response of Fire Department assets to emergencies.
                   •  Improvement in overall response times on emergency incidents.
                   •  Improvement  in technical rescue capabilities to  provide faster  specialized rescue  response and
                       reduce the need for mutual aid.


                Fire Operations            Actual         Actual       Budget        Budget        % Change
                Summary                    2017-2018     2018-2019     2019-2020     2020-2021     2020-2021
                Personnel Services      $                10,549,240  $                11,809,110  $                11,515,724  $                12,087,816  4.97%
                Operations                                  1,207,147                         897,521                         822,408                          852,218  3.62%
                  Total                 $                11,756,387  $                12,706,631  $               12,338,132  $                 12,940,034  4.88%


                    Fire Operations                   2018-2019     2019-2020    2020-2021    2020-2021
                    Full Time Equivilent Positions     Budget        Budget       Budget       Change
                    Assistant Fire Chief                  1            1            0            -1
                    Battalion Chiefs                      4            4            3            -1
                    Training Captain                      2            2            0            -2
                    Captains                              6            6            15            9
                    Lieutenants                           6            6            0            -6
                    Apparatus Operator                   12            12           12
                    Firefighter                          52            58           57           -1
                    Total                                83            89           87           -2


                                                                                                         192