
Page 76 - Keller Budget FY21
P. 76
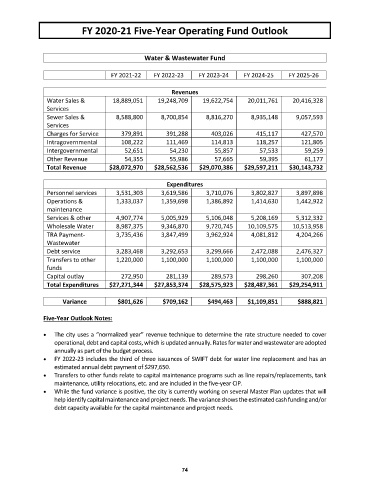
FY 2020‐21 Five‐Year Operating Fund Outlook
Water & Wastewater Fund
FY 2021‐22 FY 2022‐23 FY 2023‐24 FY 2024‐25 FY 2025‐26
Revenues
Water Sales & 18,889,051 19,248,709 19,622,754 20,011,761 20,416,328
Services
Sewer Sales & 8,588,800 8,700,854 8,816,270 8,935,148 9,057,593
Services
Charges for Service 379,891 391,288 403,026 415,117 427,570
Intragovernmental 108,222 111,469 114,813 118,257 121,805
Intergovernmental 52,651 54,230 55,857 57,533 59,259
Other Revenue 54,355 55,986 57,665 59,395 61,177
Total Revenue $28,072,970 $28,562,536 $29,070,386 $29,597,211 $30,143,732
Expenditures
Personnel services 3,531,303 3,619,586 3,710,076 3,802,827 3,897,898
Operations & 1,333,037 1,359,698 1,386,892 1,414,630 1,442,922
maintenance
Services & other 4,907,774 5,005,929 5,106,048 5,208,169 5,312,332
Wholesale Water 8,987,375 9,346,870 9,720,745 10,109,575 10,513,958
TRA Payment‐ 3,735,436 3,847,499 3,962,924 4,081,812 4,204,266
Wastewater
Debt service 3,283,468 3,292,653 3,299,666 2,472,088 2,476,327
Transfers to other 1,220,000 1,100,000 1,100,000 1,100,000 1,100,000
funds
Capital outlay 272,950 281,139 289,573 298,260 307,208
Total Expenditures $27,271,344 $27,853,374 $28,575,923 $28,487,361 $29,254,911
Variance $801,626 $709,162 $494,463 $1,109,851 $888,821
Five‐Year Outlook Notes:
The city uses a “normalized year” revenue technique to determine the rate structure needed to cover
operational, debt and capital costs, which is updated annually. Rates for water and wastewater are adopted
annually as part of the budget process.
FY 2022‐23 includes the third of three issuances of SWIFT debt for water line replacement and has an
estimated annual debt payment of $297,650.
Transfers to other funds relate to capital maintenance programs such as line repairs/replacements, tank
maintenance, utility relocations, etc. and are included in the five‐year CIP.
While the fund variance is positive, the city is currently working on several Master Plan updates that will
help identify capital maintenance and project needs. The variance shows the estimated cash funding and/or
debt capacity available for the capital maintenance and project needs.
74