
Page 69 - Keller Budget FY21
P. 69
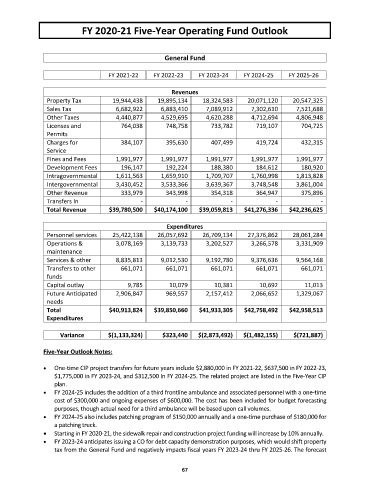
FY 2020‐21 Five‐Year Operating Fund Outlook
General Fund
FY 2021‐22 FY 2022‐23 FY 2023‐24 FY 2024‐25 FY 2025‐26
Revenues
Property Tax 19,944,438 19,895,134 18,324,583 20,071,120 20,547,325
Sales Tax 6,682,922 6,883,410 7,089,912 7,302,610 7,521,688
Other Taxes 4,440,877 4,529,695 4,620,288 4,712,694 4,806,948
Licenses and 764,038 748,758 733,782 719,107 704,725
Permits
Charges for 384,107 395,630 407,499 419,724 432,315
Service
Fines and Fees 1,991,977 1,991,977 1,991,977 1,991,977 1,991,977
Development Fees 196,147 192,224 188,380 184,612 180,920
Intragovernmental 1,611,563 1,659,910 1,709,707 1,760,998 1,813,828
Intergovernmental 3,430,452 3,533,366 3,639,367 3,748,548 3,861,004
Other Revenue 333,979 343,998 354,318 364,947 375,896
Transfers In ‐ ‐ ‐ ‐ ‐
Total Revenue $39,780,500 $40,174,100 $39,059,813 $41,276,336 $42,236,625
Expenditures
Personnel services 25,422,138 26,057,692 26,709,134 27,376,862 28,061,284
Operations & 3,078,169 3,139,733 3,202,527 3,266,578 3,331,909
maintenance
Services & other 8,835,813 9,012,530 9,192,780 9,376,636 9,564,168
Transfers to other 661,071 661,071 661,071 661,071 661,071
funds
Capital outlay 9,785 10,079 10,381 10,692 11,013
Future Anticipated 2,906,847 969,557 2,157,412 2,066,652 1,329,067
needs
Total $40,913,824 $39,850,660 $41,933,305 $42,758,492 $42,958,513
Expenditures
Variance $(1,133,324) $323,440 $(2,873,492) $(1,482,155) $(721,887)
Five‐Year Outlook Notes:
One‐time CIP project transfers for future years include $2,880,000 in FY 2021‐22, $637,500 in FY 2022‐23,
$1,775,000 in FY 2023‐24, and $312,500 In FY 2024‐25. The related project are listed in the Five‐Year CIP
plan.
FY 2024‐25 includes the addition of a third frontline ambulance and associated personnel with a one‐time
cost of $300,000 and ongoing expenses of $600,000. The cost has been included for budget forecasting
purposes, though actual need for a third ambulance will be based upon call volumes.
FY 2024‐25 also includes patching program of $150,000 annually and a one‐time purchase of $180,000 for
a patching truck.
Starting in FY 2020‐21, the sidewalk repair and construction project funding will increase by 10% annually.
FY 2023‐24 anticipates issuing a CO for debt capacity demonstration purposes, which would shift property
tax from the General Fund and negatively impacts fiscal years FY 2023‐24 thru FY 2025‐26. The forecast
67