
Page 182 - City of Bedford FY21 Budget
P. 182
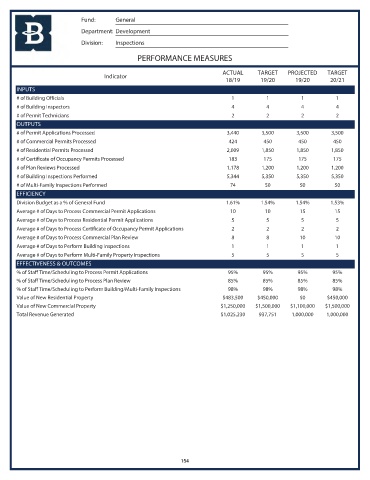
Fund:      General
                            Department: Development
                            Division:  Inspections

                                               PERFORMANCE MEASURES

                                                                           ACTUAL     TARGET    PROJECTED    TARGET
                                    Indicator
                                                                            18/19      19/20       19/20      20/21
       INPUTS
       # of Building Officials                                                1          1           1          1
       # of Building Inspectors                                               4          4           4          4
       # of Permit Technicians                                                2          2           2          2
       OUTPUTS
       # of Permit Applications Processed                                   3,440       3,500      3,500       3,500
       # of Commercial Permits Processed                                     424        450         450        450
       # of Residential Permits Processed                                   2,009       1,850      1,850       1,850
       # of Certificate of Occupancy Permits Processed                       183        175         175        175
       # of Plan Reviews Processed                                          1,178       1,200      1,200       1,200
       # of Building Inspections Performed                                  5,344       5,350      5,350       5,350
       # of Multi-Family Inspections Performed                               74          50         50          50
       EFFICIENCY
       Division Budget as a % of General Fund                               1.61%      1.54%       1.54%      1.53%
       Average # of Days to Process Commercial Permit Applications           10          10         15          15
       Average # of Days to Process Residential Permit Applications           5          5           5          5
       Average # of Days to Process Certificate of Occupancy Permit Applications   2     2           2          2
       Average # of Days to Process Commercial Plan Review                    8          8          10          10
       Average # of Days to Perform Building Inspections                      1          1           1          1
       Average # of Days to Perform Multi-Family Property Inspections         5          5           5          5
       EFFECTIVENESS & OUTCOMES
       % of Staff Time/Scheduling to Process Permit Applications            95%         95%         95%        95%
       % of Staff Time/Scheduling to Process Plan Review                    85%         85%         85%        85%
       % of Staff Time/Scheduling to Perform Building/Multi-Family Inspections   98%    98%         98%        98%
       Value of New Residential Property                                   $483,500   $450,000      $0       $450,000
       Value of New Commercial Property                                   $1,250,000  $1,500,000  $1,100,000  $1,500,000
       Total Revenue Generated                                            $1,025,230   937,751    1,000,000  1,000,000


                                                             154