
Page 174 - City of Bedford FY21 Budget
P. 174
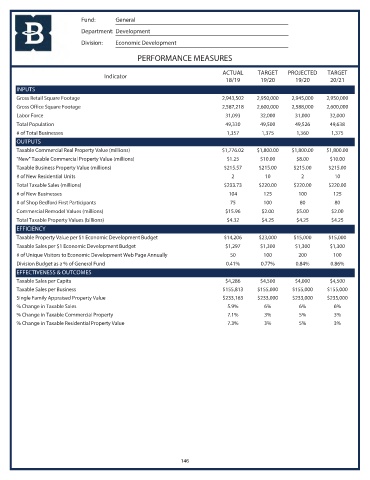
Fund:      General
                            Department: Development
                            Division:  Economic Development

                                               PERFORMANCE MEASURES

                                                                           ACTUAL     TARGET    PROJECTED    TARGET
                                    Indicator
                                                                            18/19      19/20       19/20      20/21
       INPUTS
       Gross Retail Square Footage                                        2,943,502   2,950,000   2,945,000  2,950,000
       Gross Office Square Footage                                        2,587,218   2,600,000   2,588,000  2,600,000
       Labor Force                                                          31,093     32,000      31,000     32,000
       Total Population                                                     49,330     49,500      49,526     49,638
       # of Total Businesses                                                1,357       1,375      1,360       1,375
       OUTPUTS
       Taxable Commercial Real Property Value (millions)                  $1,776.02   $1,800.00   $1,800.00  $1,800.00
       "New" Taxable Commercial Property Value (millions)                   $1.25      $10.00      $8.00      $10.00
       Taxable Business Property Value (millions)                          $215.57     $215.00    $215.00     $215.00
       # of New Residential Units                                             2          10          2          10
       Total Taxable Sales (millions)                                      $233.73     $220.00    $220.00     $220.00
       # of New Businesses                                                   104        125         100        125
       # of Shop Bedford First Participants                                  75         100         80          80
       Commercial Remodel Values (millions)                                 $15.96      $2.00      $5.00       $2.00
       Total Taxable Property Values (billions)                             $4.32       $4.25      $4.25       $4.25
       EFFICIENCY
       Taxable Property Value per $1 Economic Development Budget           $14,206     $23,000    $15,000     $15,000
       Taxable Sales per $1 Economic Development Budget                     $1,297     $1,300      $1,300     $1,300
       # of Unique Visitors to Economic Development Web Page Annually        50         100         200        100
       Division Budget as a % of General Fund                               0.41%      0.77%       0.84%      0.86%
       EFFECTIVENESS & OUTCOMES
       Taxable Sales per Capita                                             $4,286     $4,500      $4,000     $4,500
       Taxable Sales per Business                                          $155,813   $155,000    $155,000   $155,000
       Single Family Appraised Property Value                              $233,163   $233,000    $233,000   $235,000
       % Change in Taxable Sales                                            5.9%        6%          6%         6%
       % Change in Taxable Commercial Property                              7.1%        3%          5%         3%
       % Change in Taxable Residential Property Value                       7.3%        3%          5%         3%


                                                             146