
Page 140 - City of Bedford FY21 Budget
P. 140
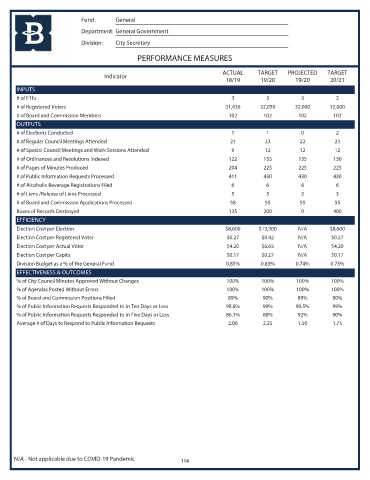
Fund:      General
                            Department: General Government
                            Division:  City Secretary

                                               PERFORMANCE MEASURES

                                                                           ACTUAL     TARGET    PROJECTED    TARGET
                                    Indicator
                                                                            18/19      19/20       19/20      20/21
       INPUTS
       # of FTEs                                                              3          3           3          2
       # of Registered Voters                                               31,436     32,050      32,000     32,000
       # of Board and Commission Members                                     102        102         102        102
       OUTPUTS
       # of Elections Conducted                                               1          1           0          2
       # of Regular Council Meetings Attended                                21          23         22          23
       # of Special Council Meetings and Work Sessions Attended               9          12         12          12
       # of Ordinances and Resolutions Indexed                               122        135         135        130
       # of Pages of Minutes Produced                                        204        225         225        225
       # of Public Information Requests Processed                            411        430         430        430
       # of Alcoholic Beverage Registrations Filed                            6          6           6          6
       # of Liens /Release of Liens Processed                                 5          5           2          3
       # of Board and Commission Applications Processed                      58          55         55          55
       Boxes of Records Destroyed                                            125        200          0         400
       EFFICIENCY
       Election Cost per Election                                           $8,600     $13,300      N/A       $8,600
       Election Cost per Registered Voter                                   $0.27       $0.42       N/A        $0.27
       Election Cost per Actual Voter                                       $4.20       $6.65       N/A        $4.20
       Election Cost per Capita                                             $0.17       $0.27       N/A        $0.17
       Division Budget as a % of the General Fund                           0.85%      0.83%       0.74%      0.73%
       EFFECTIVENESS & OUTCOMES
       % of City Council Minutes Approved Without Changes                   100%        100%       100%        100%
       % of Agendas Posted Without Errors                                   100%        100%       100%        100%
       % of Board and Commission Positions Filled                           89%         90%         89%        90%
       % of Public Information Requests Responded to in Ten Days or Less    98.8%       99%        99.5%       99%
       % of Public Information Requests Responded to in Five Days or Less   86.1%       88%         92%        90%
       Average # of Days to Respond to Public Information Requests           2.06       2.25        1.50       1.75


      N/A - Not applicable due to COVID-19 Pandemic          114