
Page 166 - FY 2009 Proposed Budget
P. 166
General Fund
of
Contents
Table of Contents
Table
Table of Contents
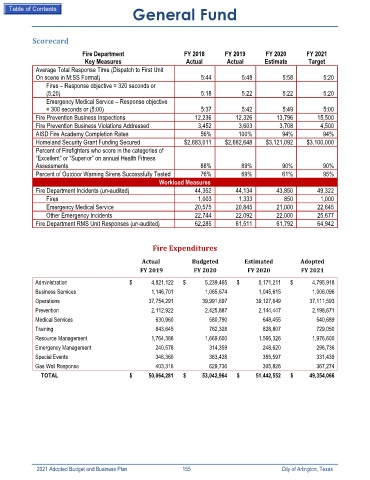
Scorecard
Fire Department FY 2018 FY 2019 FY 2020 FY 2021
Key Measures Actual Actual Estimate Target
Average Total Response Time (Dispatch to First Unit
On scene in M:SS Format) 5:44 5:48 5:58 5:20
Fires – Response objective = 320 seconds or
(5:20) 5:18 5:22 5:22 5:20
Emergency Medical Service – Response objective
= 300 seconds or (5:00) 5:37 5:42 5:49 5:00
Fire Prevention Business Inspections 12,236 12,326 13,796 15,500
Fire Prevention Business Violations Addressed 3,452 3,603 3,708 4,500
AISD Fire Academy Completion Rates 56% 100% 94% 94%
Homeland Security Grant Funding Secured $2,683,011 $2,682,648 $3,121,092 $3,100,000
Percent of Firefighters who score in the categories of
“Excellent” or “Superior” on annual Health Fitness
Assessments 88% 89% 90% 90%
Percent of Outdoor Warning Sirens Successfully Tested 76% 69% 61% 95%
Workload Measures
Fire Department Incidents (un-audited) 44,352 44,134 43,850 49,322
Fires 1,003 1,333 850 1,000
Emergency Medical Service 20,575 20,845 21,000 22,645
Other Emergency Incidents 22,744 22,092 22,000 25,677
Fire Department RMS Unit Responses (un-audited) 62,285 61,511 61,792 64,942
Fire Expenditures
Actual Budgeted Estimated Adopted
FY 2019 FY 2020 FY 2020 FY 2021
Administration $ 4,821,122 $ 5,239,465 $ 5,171,211 $ 4,795,918
Business Services 1,146,701 1,065,674 1,045,615 1,006,096
Operations 37,754,291 39,991,697 39,127,649 37,111,593
Prevention 2,112,922 2,425,887 2,144,447 2,198,671
Medical Services 630,960 580,790 648,455 540,689
Training 843,645 762,328 828,807 729,050
Resource Management 1,764,386 1,669,600 1,566,326 1,976,600
Emergency Management 240,578 314,359 248,620 296,736
Special Events 346,360 363,428 355,597 331,439
Gas Well Response 403,316 629,736 305,826 367,274
TOTAL $ 50,064,281 $ 53,042,964 $ 51,442,552 $ 49,354,066
2021 Adopted Budget and Business Plan 155 City of Arlington, Texas