
Page 171 - FY 2009 Proposed Budget
P. 171
General Fund
Contents
Contents
Table of Contents
of
Table
Table
of
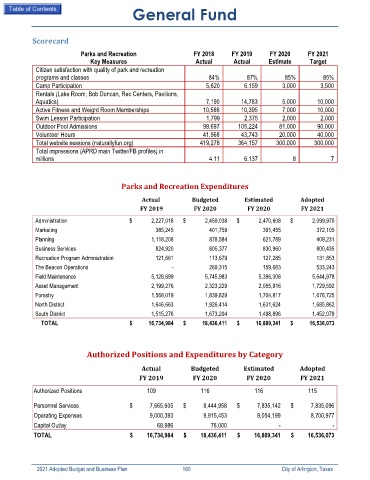
Scorecard
Parks and Recreation FY 2018 FY 2019 FY 2020 FY 2021
Key Measures Actual Actual Estimate Target
Citizen satisfaction with quality of park and recreation
programs and classes 84% 87% 85% 85%
Camp Participation 5,620 6,159 3,000 3,500
Rentals (Lake Room, Bob Duncan, Rec Centers, Pavilions,
Aquatics) 7,190 14,783 5,000 10,000
Active Fitness and Weight Room Memberships 10,586 10,395 7,000 10,000
Swim Lesson Participation 1,799 2,375 2,000 2,000
Outdoor Pool Admissions 99,697 105,224 81,000 90,000
Volunteer Hours 41,568 43,743 20,000 40,000
Total website sessions (naturallyfun.org) 419,278 364,157 300,000 300,000
Total impressions (APRD main Twitter/FB profiles) in
millions 4.11 6.137 8 7
Parks and Recreation Expenditures
Actual Budgeted Estimated Adopted
FY 2019 FY 2020 FY 2020 FY 2021
Administration $ 2,227,018 $ 2,459,038 $ 2,470,608 $ 2,099,970
Marketing 385,245 401,759 391,455 372,105
Planning 1,118,208 878,584 621,789 409,231
Business Services 824,920 805,377 830,960 800,435
Recreation Program Administration 121,661 113,679 127,285 131,853
The Beacon Operations - 269,315 159,683 533,243
Field Maintenance 5,128,699 5,745,983 5,396,308 5,644,978
Asset Management 2,199,276 2,323,229 2,055,916 1,729,592
Forestry 1,568,019 1,839,829 1,704,817 1,676,725
North District 1,646,663 1,926,414 1,631,624 1,685,862
South District 1,515,276 1,673,204 1,498,896 1,452,079
TOTAL $ 16,734,984 $ 18,436,411 $ 16,889,341 $ 16,536,073
Authorized Positions and Expenditures by Category
Actual Budgeted Estimated Adopted
FY 2019 FY 2020 FY 2020 FY 2021
Authorized Positions 109 116 116 115
Personnel Services $ 7,665,605 $ 8,444,958 $ 7,835,142 $ 7,835,096
Operating Expenses 9,000,393 9,915,453 9,054,199 8,700,977
Capital Outlay 68,986 76,000 - -
TOTAL $ 16,734,984 $ 18,436,411 $ 16,889,341 $ 16,536,073
2021 Adopted Budget and Business Plan 160 City of Arlington, Texas