
Page 332 - NRH FY20 Approved Budget
P. 332
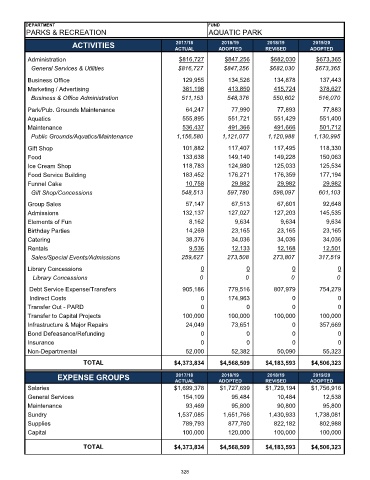
DEPARTMENT                                                  FUND
          PARKS & RECREATION                                          AQUATIC PARK
                         ACTIVITIES                        2017/18        2018/19        2018/19         2019/20
                                                           ACTUAL        ADOPTED         REVISED        ADOPTED
           Administration                                   $816,727       $847,256        $682,030       $673,365
             General Services & Utilities                   $816,727       $847,256       $682,030       $673,365

           Business Office                                   129,955         134,526        134,878        137,443
           Marketing / Advertising                           381,198         413,850        415,724        378,627
             Business & Office Administration                511,153        548,376        550,602        516,070
           Park/Pub. Grounds Maintenance                      64,247          77,990         77,893         77,883
           Aquatics                                          555,895         551,721        551,429        551,400
           Maintenance                                       536,437         491,366        491,666        501,712
             Public Grounds/Aquatics/Maintenance           1,156,580       1,121,077      1,120,988      1,130,995

           Gift Shop                                         101,882         117,407        117,495        118,330
           Food                                              133,638         149,140        149,228        150,063
           Ice Cream Shop                                    118,783         124,980        125,033        125,534
           Food Service Building                             183,452         176,271        176,359        177,194
           Funnel Cake                                        10,758          29,982         29,982         29,982
             Gift Shop/Concessions                           548,513        597,780        598,097        601,103
           Group Sales                                        57,147          67,513         67,601         92,648
           Admissions                                        132,137         127,027        127,203        145,535
           Elements of Fun                                      8,162          9,634          9,634          9,634
           Birthday Parties                                   14,269          23,165         23,165         23,165
           Catering                                           38,376          34,036         34,036         34,036
           Rentals                                              9,536         12,133         12,168         12,501
             Sales/Special Events/Admissions                 259,627        273,508        273,807        317,519

           Library Concessions                                     0               0              0              0
              Library Concessions                                  0              0              0              0
            Debt Service Expense/Transfers                   905,186         779,516        807,979        754,279
            Indirect Costs                                         0         174,963              0              0
          Transfer  Out  -  PARD                                   0               0              0              0
           Transfer to Capital Projects                      100,000         100,000        100,000        100,000
           Infrastructure & Major Repairs                     24,049          73,651              0        357,669
           Bond Defeasance/Refunding                               0               0              0              0
          Insurance                                                0               0              0              0
           Non-Departmental                                   52,000          52,382         50,090         55,323
                             TOTAL                         $4,373,834     $4,568,509     $4,183,593     $4,506,323

                    EXPENSE GROUPS                         2017/18        2018/19        2018/19         2019/20
                                                           ACTUAL        ADOPTED         REVISED        ADOPTED
           Salaries                                        $1,699,378     $1,727,699     $1,729,194     $1,756,916
           General Services                                  154,109          95,484         10,484         12,538
           Maintenance                                        93,469          95,800         90,800         95,800
           Sundry                                           1,537,085      1,651,766      1,430,933      1,738,081
           Supplies                                          789,793         877,760        822,182        802,988
           Capital                                           100,000         120,000        100,000        100,000


                             TOTAL                         $4,373,834     $4,568,509     $4,183,593     $4,506,323


                                                             328