
Page 270 - Mansfieldr FY20 Approved Budget
P. 270
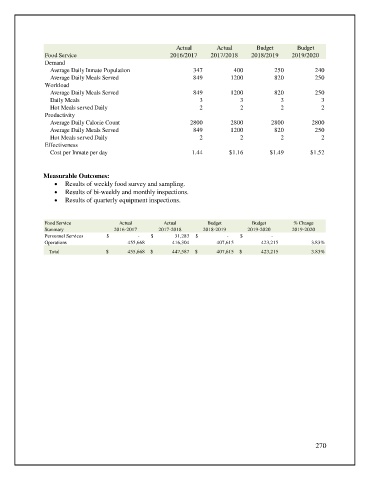
Actual        Actual       Budget       Budget
                Food Service                             2016/2017     2017/2018    2018/2019     2019/2020
                Demand
                  Average Daily Inmate Population                347          400           250          240
                  Average Daily Meals Served                     849         1200           820          250
                Workload
                  Average Daily Meals Served                     849         1200           820          250
                  Daily Meals                                      3             3            3            3
                  Hot Meals served Daily                           2             2            2            2
                Productivity
                  Average Daily Calorie Count                   2800         2800          2800         2800
                  Average Daily Meals Served                     849         1200           820          250
                  Hot Meals served Daily                           2             2            2            2
                Effectiveness
                  Cost per Inmate per day                       1.44         $1.16        $1.49         $1.52


               Measurable Outcomes:
                   •  Results of weekly food survey and sampling.
                   •  Results of bi-weekly and monthly inspections.
                   •  Results of quarterly equipment inspections.


                Food Service            Actual         Actual         Budget        Budget        % Change
                Summary                2016-2017     2017-2018      2018-2019      2019-2020      2019-2020
                Personnel Services  $                         -    $                     31,283  $                          -  $                          -

                Operations                             455,668                      416,304                       407,615                       423,215  3.83%

                 Total              $                  455,668  $                  447,587  $                   407,615  $                 423,215  3.83%


                                                                                                         270