
Page 240 - Mansfieldr FY20 Approved Budget
P. 240
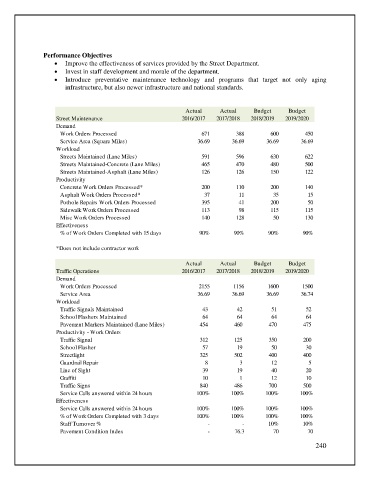
Performance Objectives
                   •  Improve the effectiveness of services provided by the Street Department.
                   •  Invest in staff development and morale of the department.
                   •  Introduce preventative maintenance  technology and programs that  target  not only  aging
                       infrastructure, but also newer infrastructure and national standards.


                                                              Actual      Actual     Budget     Budget
                    Street Maintenance                       2016/2017   2017/2018  2018/2019  2019/2020
                    Demand
                     Work Orders Processed                          671        388         600        450
                     Service Area (Square Miles)                  36.69       36.69      36.69       36.69
                    Workload
                     Streets Maintained (Lane Miles)                591        596         630        622
                     Streets Maintained-Concrete (Lane Miles)       465        470         480        500
                     Streets Maintained-Asphalt (Lane Miles)        126        126         150        122
                    Productivity
                     Concrete Work Orders Processed*                200        110         200        140
                     Asphalt Work Orders Processed*                  37         11         35          15
                     Pothole Repairs Work Orders Processed          395         41         200         50
                     Sidewalk Work Orders Processed                 113         98         115        115
                     Misc Work Orders Processed                     140        128         50         130
                    Effectiveness
                     % of Work Orders Completed with 15 days       90%        90%         90%        90%

                    *Does not include contractor work


                                                              Actual      Actual     Budget     Budget
                    Traffic Operations                       2016/2017   2017/2018  2018/2019  2019/2020
                    Demand
                     Work Orders Processed                         2155       1156        1600       1500
                     Service Area                                 36.69       36.69      36.69       36.74
                    Workload


                     Traffic Signals Maintained                               43                    42                    51                      52
                     School Flashers Maintained                                 64                      64                      64                    64

                     Pavement Markers Maintained (Lane Miles)                    454                    460                  470                  475


                    Productivity - Work Orders


                     Traffic Signal                                         312                  125                    350                    200

                     School Flasher                                             57                    19                    50                      30

                     Streetlight                                              325                    502                  400                  400


                     Guardrail Repair                                           8                        3                        12                        5
                     Line of Sight                                            39                      19                      40                      20

                     Graffiti                                                   10                      1                        12                      10

                     Traffic Signs                                            840                  486                  700                    500

                     Service Calls answered within 24 hours       100%       100%        100%       100%
                    Effectiveness
                     Service Calls answered within 24 hours       100%       100%        100%       100%
                     % of Work Orders Completed with 3 days       100%       100%        100%       100%
                     Staff Turnover %                                 -          -        10%        10%
                     Pavement Condition Index                         -        76.3        70          70
                                                                                                         240