
Page 199 - Mansfieldr FY20 Approved Budget
P. 199
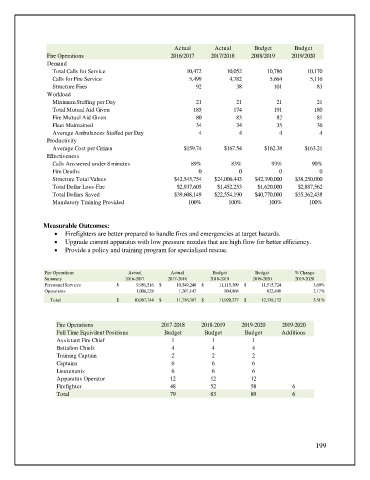
Actual       Actual       Budget        Budget
                 Fire Operations                         2016/2017     2017/2018    2018/2019    2019/2020
                 Demand
                  Total Calls for Service                      10,472       10,052       10,786        10,170
                  Calls for Fire Service                        5,499        4,782        5,664         5,116
                  Structure Fires                                 92           38           101           83
                 Workload
                  Minimum Staffing per Day                        21           21            21           21
                  Total Mutual Aid Given                         185          174           191          180
                  Fire Mutual Aid Given                           80           83            82           81
                  Fleet Maintained                                34           34            35           36
                  Average Ambulances Staffed per Day               4            4            4             4
                 Productivity
                  Average Cost per Citizen                    $159.74      $167.54      $162.38       $163.21
                 Effectiveness
                  Calls Answered under 8 minutes                89%           83%          93%          90%
                  Fire Deaths                                      0            0            0             0
                  Structure Total Values                   $42,545,754  $24,006,443  $42,390,000   $38,250,000
                  Total Dollar Loss-Fire                    $2,937,605   $1,452,253   $1,620,000    $2,887,562
                  Total Dollars Saved                      $39,608,149  $22,554,190  $40,770,000   $35,362,438
                  Mandatory Training Provided                  100%          100%         100%         100%


               Measurable Outcomes:
                   •  Firefighters are better prepared to handle fires and emergencies at target hazards.
                   •  Upgrade current apparatus with low pressure nozzles that are high flow for better efficiency.
                   •  Provide a policy and training program for specialized rescue.


                Fire Operations            Actual         Actual       Budget        Budget        % Change
                Summary                    2016-2017     2017-2018     2018-2019     2019-2020     2019-2020
                Personnel Services      $                  9,981,516  $                10,549,240  $                11,115,309  $                11,515,724  3.60%
                Operations                                  1,006,228                      1,207,147                         804,968                         822,408  2.17%
                  Total                 $                10,987,744  $                11,756,387  $                11,920,277  $                12,338,132  3.51%


                    Fire Operations                   2017-2018     2018-2019    2019-2020    2019-2020
                    Full Time Equivilent Positions     Budget        Budget       Budget      Additions
                    Assistant Fire Chief                  1            1            1
                    Battalion Chiefs                      4            4            4
                    Training Captain                      2            2            2
                    Captains                              6            6            6
                    Lieutenants                           6            6            6
                    Apparatus Operator                   12            12           12
                    Firefighter                          48            52           58            6
                    Total                                79            83           89            6


                                                                                                         199