Page 66 - Haltom City FY20 Approved Budget
P. 66

City of Haltom City Annual Budget, FY 2020
                                                                                        General Fund


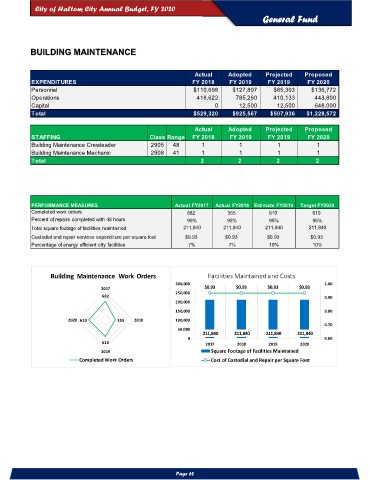
           BUILDING MAINTENANCE


                                                                 Actual      Adopted     Projected    Proposed
           EXPENDITURES                                          FY 2018     FY 2019      FY 2019      FY 2020
           Personnel                                             $110,698     $127,807      $85,303     $136,772
           Operations                                             418,622      785,260      410,133      443,800
           Capital                                                      0       12,500       12,500      648,000
           Total                                                 $529,320     $925,567    $507,936    $1,228,572

                                                                 Actual      Adopted     Projected    Proposed
           STAFFING                                Class Range   FY 2018     FY 2019      FY 2019      FY 2020
           Building Maintenance Crewleader         2905   48        1           1            1            1
           Building Maintenance Mechanic           2908   41        1           1            1            1
           Total                                                   2            2            2            2


           PERFORMANCE MEASURES                            Actual FY2017  Actual FY2018  Estimate FY2019  Target FY2020
           Completed work orders                               682          355           610           610
           Percent of repairs completed with 48 hours          90%          95%           95%           95%
           Total square footage of facilities maintained      211,840      211,840       211,840       211,840
           Custodial and repair services expenditure per square foot  $0.93  $0.93       $0.93          $0.93
           Percentage of energy efficient city facilities      7%            7%           10%           10%


                  Building  Maintenance  Work  Orders                 Facilities Maintained and Costs
                                                           300,000                                          1.00
                                  2017                               $0.93     $0.93      $0.93     $0.93
                                                           250,000
                                   682                                                                      0.90
                                                           200,000
                                                           150,000                                          0.80
                        2020  610       355   2018         100,000
                                                                                                            0.70
                                                            50,000
                                                                    211,840    211,840   211,840   211,840
                                                               0                                            0.60
                                   610                               2017      2018       2019      2020
                                  2019                                 Square Footage of Facilities Maintained
                           Completed Work Orders                       Cost of Costodial and Repair per Square Foot


                                                           Page 62
   61   62   63   64   65   66   67   68   69   70   71