
Page 310 - City of Bedford FY20 Approved Budget
P. 310
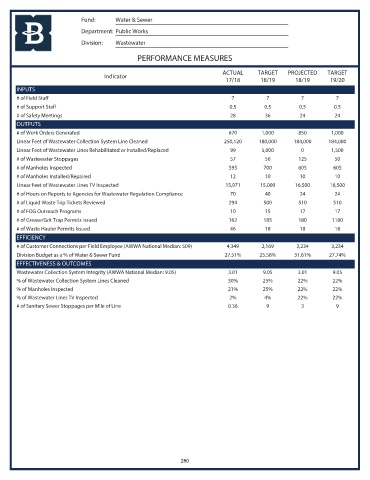
Fund:      Water & Sewer
                            Department: Public Works
                            Division:  Wastewater

                                               PERFORMANCE MEASURES

                                                                           ACTUAL     TARGET    PROJECTED    TARGET
                                    Indicator
                                                                            17/18      18/19       18/19      19/20
       INPUTS
       # of Field Staff                                                       7          7           7          7
       # of Support Staff                                                    0.5         0.5        0.5         0.5
       # of Safety Meetings                                                  28          36         24          24
       OUTPUTS
       # of Work Orders Generated                                            670        1,000       850        1,000
       Linear Feet of Wastewater Collection System Line Cleaned            250,120     180,000    184,000     184,000
       Linear Feet of Wastewater Lines Rehabilitated or Installed/Replaced   99         5,000        0         1,500
       # of Wastewater Stoppages                                             57          50         125         50
       # of Manholes Inspected                                               595        700         605        605
       # of Manholes Installed/Repaired                                      12          10         10          10
       Linear Feet of Wastewater Lines TV Inspected                         15,971     15,000      16,500     16,500
       # of Hours on Reports to Agencies for Wastewater Regulation Compliance  70        40         24          24
       # of Liquid Waste Trip Tickets Reviewed                               294        500         510        510
       # of FOG Outreach Programs                                            10          15         17          17
       # of Grease/Grit Trap Permits Issued                                  162        185         180        1180
       # of Waste Hauler Permits Issued                                      46          18         18          18
       EFFICIENCY
       # of Customer Connections per Field Employee (AWWA National Median: 509)  4,349  2,169      3,234       3,234
       Division Budget as a % of Water & Sewer Fund                        27.51%      25.58%     31.61%      27.74%
       EFFECTIVENESS & OUTCOMES
       Wastewater Collection System Integrity (AWWA National Median: 9.05)   3.01       9.05        3.01       9.05
       % of Wastewater Collection System Lines Cleaned                      30%         25%         22%        22%
       % of Manholes Inspected                                              21%         25%         22%        22%
       % of Wastewater Lines TV Inspected                                    2%         4%          22%        22%
       # of Sanitary Sewer Stoppages per Mile of Line                        0.36        9           3          9


                                                             280