
Page 306 - City of Bedford FY20 Approved Budget
P. 306
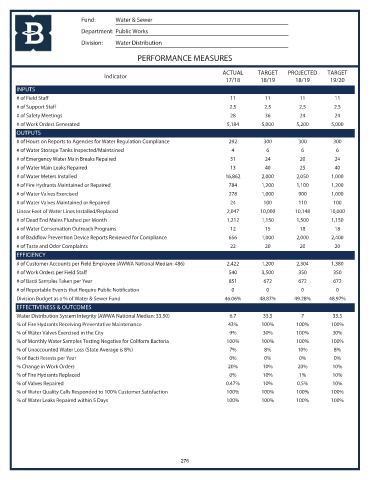
Fund:      Water & Sewer
                            Department: Public Works
                            Division:  Water Distribution

                                               PERFORMANCE MEASURES

                                                                           ACTUAL     TARGET    PROJECTED    TARGET
                                    Indicator
                                                                            17/18      18/19       18/19      19/20
       INPUTS
       # of Field Staff                                                      11          11         11          11
       # of Support Staff                                                    2.5         2.5        2.5         2.5
       # of Safety Meetings                                                  28          36         24          24
       # of Work Orders Generated                                           5,184       5,000      5,200       5,000
       OUTPUTS
       # of Hours on Reports to Agencies for Water Regulation Compliance     292        300         300        300
       # of Water Storage Tanks Inspected/Maintained                          4          6           6          6
       # of Emergency Water Main Breaks Repaired                             31          24         20          24
       # of Water Main Leaks Repaired                                        13          40         25          40
       # of Water Meters Installed                                          16,862      2,000      2,050       1,000
       # of Fire Hydrants Maintained or Repaired                             784        1,200      1,100       1,200
       # of Water Valves Exercised                                           278        1,000       900        1,000
       # of Water Valves Maintained or Repaired                              24         100         110        100
       Linear Feet of Water Lines Installed/Replaced                        2,047      10,000      10,148     10,000
       # of Dead End Mains Flushed per Month                                1,212       1,150      1,500       1,150
       # of Water Conservation Outreach Programs                             12          15         18          18
       # of Backflow Prevention Device Reports Reviewed for Compliance       656        1,000      2,000       2,400
       # of Taste and Odor Complaints                                        22          20         20          20
       EFFICIENCY
       # of Customer Accounts per Field Employee (AWWA National Median: 486)  2,422     1,200      2,304       1,380
       # of Work Orders per Field Staff                                      540        3,500       350        350
       # of Bacti Samples Taken per Year                                     851        672         672        672
       # of Reportable Events that Require Public Notification                0          0           0          0
       Division Budget as a % of Water & Sewer Fund                        46.06%      48.87%     49.28%      48.97%
       EFFECTIVENESS & OUTCOMES
       Water Distribution System Integrity (AWWA National Median: 33.50)     6.7        33.5         7         33.5
       % of Fire Hydrants Receiving Preventative Maintenance                43%         100%       100%        100%
       % of Water Valves Exercised in the City                               9%         30%        100%        30%
       % of Monthly Water Samples Testing Negative for Coliform Bacteria    100%        100%       100%        100%
       % of Unaccounted Water Loss (State Average is 8%)                     7%         8%          10%        8%
       % of Bacti Retests per Year                                           0%         0%          0%         0%
       % Change in Work Orders                                              20%         10%         20%        10%
       % of Fire Hydrants Replaced                                           0%         10%         1%         10%
       % of Valves Repaired                                                 0.47%       10%        0.5%        10%
       % of Water Quality Calls Responded to 100% Customer Satisfaction     100%        100%       100%        100%
       % of Water Leaks Repaired within 5 Days                              100%        100%       100%        100%


                                                             276