
Page 180 - City of Bedford FY20 Approved Budget
P. 180
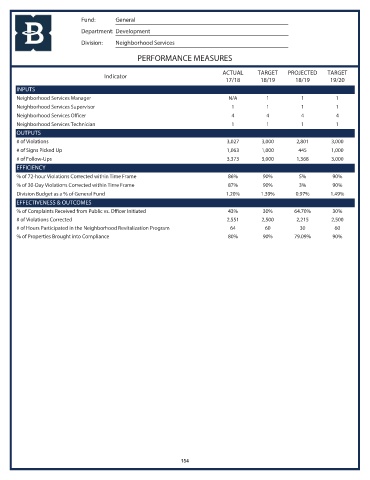
Fund:      General
                            Department: Development
                            Division:  Neighborhood Services

                                               PERFORMANCE MEASURES

                                                                           ACTUAL     TARGET    PROJECTED    TARGET
                                    Indicator
                                                                            17/18      18/19       18/19      19/20
       INPUTS
       Neighborhood Services Manager                                         N/A         1           1          1
       Neighborhood Services Supervisor                                       1          1           1          1
       Neighborhood Services Officer                                          4          4           4          4
       Neighborhood Services Technician                                       1          1           1          1
       OUTPUTS
       # of Violations                                                      3,027       3,000      2,801       3,000
       # of Signs Picked Up                                                 1,063       1,000       445        1,000
       # of Follow-Ups                                                      3,373       3,000      1,368       3,000
       EFFICIENCY
       % of 72-hour Violations Corrected within Time Frame                  86%         90%         5%         90%
       % of 30-Day Violations Corrected within Time Frame                   87%         90%         3%         90%
       Division Budget as a % of General Fund                               1.20%      1.39%       0.97%      1.49%
       EFFECTIVENESS & OUTCOMES
       % of Complaints Received from Public vs. Officer Initiated           43%         30%       64.70%       30%
       # of Violations Corrected                                            2,551       2,500      2,215       2,500
       # of Hours Participated in the Neighborhood Revitalization Program    64          60         30          60
       % of Properties Brought into Compliance                              80%         90%       79.09%       90%


                                                             154