
Page 176 - City of Bedford FY20 Approved Budget
P. 176
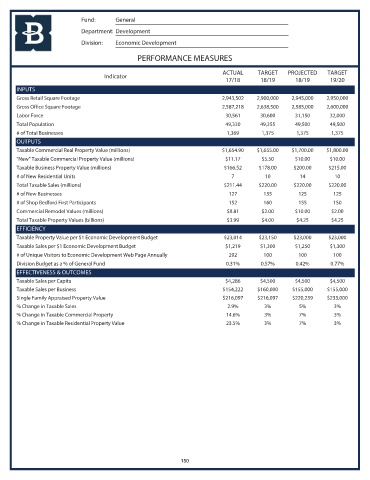
Fund:      General
                            Department: Development
                            Division:  Economic Development

                                               PERFORMANCE MEASURES

                                                                           ACTUAL     TARGET    PROJECTED    TARGET
                                    Indicator
                                                                            17/18      18/19       18/19      19/20
       INPUTS
       Gross Retail Square Footage                                        2,943,502   2,900,000   2,945,000  2,950,000
       Gross Office Square Footage                                        2,587,218   2,638,500   2,585,000  2,600,000
       Labor Force                                                          30,561     30,600      31,150     32,000
       Total Population                                                     49,330     49,355      49,500     49,500
       # of Total Businesses                                                1,369       1,375      1,375       1,375
       OUTPUTS
       Taxable Commercial Real Property Value (millions)                  $1,654.90   $1,655.00   $1,700.00  $1,800.00
       "New" Taxable Commercial Property Value (millions)                   $11.17      $5.50      $10.00     $10.00
       Taxable Business Property Value (millions)                          $166.52     $178.00    $200.00     $215.00
       # of New Residential Units                                             7          10         14          10
       Total Taxable Sales (millions)                                      $211.44     $220.00    $220.00     $220.00
       # of New Businesses                                                   127        135         125        125
       # of Shop Bedford First Participants                                  152        160         155        150
       Commercial Remodel Values (millions)                                 $8.81       $2.00      $10.00      $2.00
       Total Taxable Property Values (billions)                             $3.99       $4.00      $4.25       $4.25
       EFFICIENCY
       Taxable Property Value per $1 Economic Development Budget           $23,014     $23,150    $23,000     $23,000
       Taxable Sales per $1 Economic Development Budget                     $1,219     $1,300      $1,250     $1,300
       # of Unique Visitors to Economic Development Web Page Annually        292        100         100        100
       Division Budget as a % of General Fund                               0.31%      0.57%       0.42%      0.77%
       EFFECTIVENESS & OUTCOMES
       Taxable Sales per Capita                                             $4,286     $4,500      $4,500     $4,500
       Taxable Sales per Business                                          $154,222   $160,000    $155,000   $155,000
       Single Family Appraised Property Value                              $216,097   $216,097    $220,239   $233,000
       % Change in Taxable Sales                                            2.9%        3%          5%         3%
       % Change in Taxable Commercial Property                              14.6%       3%          7%         3%
       % Change in Taxable Residential Property Value                       23.5%       3%          7%         3%


                                                             150