
Page 461 - Microsoft Word - FY 2020 Adopted Budget Document
P. 461
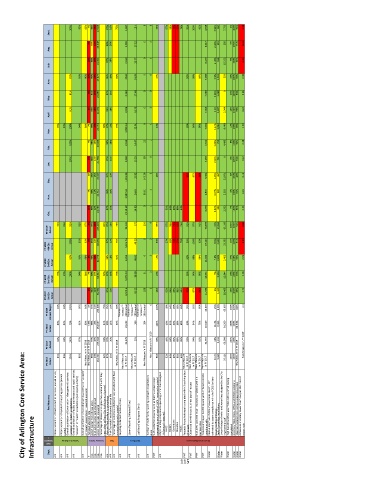
100%  92%  82%  7%  99%  28%  17,825  97%  16%  75%  1,697  13.4  0  33%  57%  58%  74%  55%  75%  91%  100%  92%  4,949  2.93%  867  7,753  5%  100%  91%  0.08
                 Sept.                             0
                               9%  93%  16%  23,549  98%  16%  2,099  17.12  0  6,017  2.46%  919  250  5%  100%  91%  0.48
                 Aug.                              1
                               10%  96%  26%  21,302  97%  18%  2,050  12.77  0  8,159  3.18%  958  15,352  5%  100%  91%  0.41
                 July                              1
                         81%  91%  90%  10%  95%  28%  17,677  96%  18%  84%  2069  14.39  0  17%  92%  99%  89%  7,008  2.9%  1,034  358  13%  100%  93%  0.48
                 June                              0

                         81%   9%  95%  16%  22,893  97%  18%  0     7,008  2.46%  1,268  0  10%  100%  93%  0.96
                 May                               0
                         81%   6%  95%  18%  22,206  95%  18%                 2,026                 2,169                  16.75                 17.68   0  7,008  2.2%  1,397  2,044  14%  100%  93%  0.65
                 April                             3

                    76%  81%  100%  94%  88%  7%  98%  16%  22,474  60%  97%  18%  75%  12.01  0  23%  95%  96%  95%  7,504  1.44%  1,042  8,449  12%  100%  90%  1.29
                 Mar.                      1,839.14  1
                         100%  7%  98%  14%  20,085  95%  18%  2,065  14.47  22  5,921  1.66%  790  4,495  9%  100%  91%  0.48
                 Feb.                              1
                         100%  8%  98%  15%  21,768  97%  18%  2,069  12.51  69  5,239  2.36%  794  0  8%  100%  91%  0.32
                 Jan.                              0

                               6%  98%  13%  19,117  97%  20%  11.92  143.26  26%  82%  87%  84%  5,362  1.45%  467  21,871  6%  100%  89%  0.49
                 Dec.                      1,925.98  0
                               7%  98%  11%  21,712  96%  20%  14.65  56.81  2,955  0.97%  580  2,392  6%  100%  91%  0.81
                 Nov.                      1,997.24  1
                               11%  98%  12%  24,563  97%  20%  2,119.38  14.65  0  50%  64%  89%  88%  64%  3,270  0.92%  383  2,202  7%  100%  91%  0.41
                 Oct.                              1
                    76%  81%  92%  92%  87%  8%  97%  16%  255,281  60%  97%  18%  78%  24,126  172  291  99%  57%  58%  74%  55%  75%  91%  97%  91%  70,399  25%  10,394  65,166  100%  100%  91%  6.86
                 FY 2019   Actual                  9

                FY 2019   4th Qtr.  Actual  100%  92%  82%  9%  95%  14%  62,676  97%  17%  75%  5,845.76  43.29  0  2  33%  57%  58%  74%  55%  75%  93%  100%  92%  19,125  8.6%  2,639  23,355  15%  100%  91%  0.97

                         81%  91%  90%  8%  95%  21%  62,776  96%  18%  84%  6,264  48.82  0  17%  92%  99%  89%  21,024  7.6%  3,699  2,402  37%  100%  93%  2.09
                FY 2019   3rd Qtr.  Actual         3
                    76%  81%  100%  94%  88%  7%  98%  15%  64,327  60%  97%  18%  75%  5,973.14  38.99  91  23%  95%  96%  95%  18,664  5%  2,626  12,944  29%  100%  91%  2.09
                FY 2019  2nd Qtr.  Actual          2
                               9%  98%  12%  65,392  97%  20%  6,042.6  41.22  200  26%  50%  64%  89%  88%  64%  82%  87%  84%  11,586  3%  1,430  26,465  19%  100%  89%  1.71
                FY 2019  1st Qtr.  Actual          2

                 FY 2019   Annual Target  83%  83%  100%  90%  90%  5%  97%  10%  230,000  70%  95%  20%  90%  Maintain or   increase FY   2018 actual  Maintain or   increase FY   2018 actual  Maintain or   increase FY   2018 actual  6  100%  49%  64%  89%  88%  65%  90%  95%  95%  40,000  20%  9,000  65,000  100%  100%  >88%  6.5

                    83%  83%  75%  91%  80%  7.8%  98%  16%  254,557  64%  95%  21%  62%  23,242  180  394  121%  49%  64%  89%  88%  65%  90%  64%  75%  46,549  16.4%  8,463  81,209  100%  100%  88.94%
                 FY 2018  Actual

                    84%  84%  100%  87%  97%  16%  239,588  63%  97%  20%  23,879  155  88%  49%  64%  89%  88%  65%  93%  94%  82%  34,787  28%  9,194  68,099  100%  100%
                 FY 2017  FY 2016   Actual  Actual  85%  84%  100%  88%  New Measure in FY 2018 New Measure in FY 2018  96%  13%  264,311  62%  97%  18%  New Measure in FY 2018  New Measure   in FY 2017  New Measure   in FY 2017  New Measure in FY 2018  New Measure in FY 2019  96%  52%  64%  89%  88%  63%  in FY 2017  New Measure   in FY 2017  New Measure   in FY 2017  New Measure   in FY 2017  20.2%  9,845  56,111  100%  100% New Measure in FY 2018  New Measure in FY 2019
         City of Arlington Core Service Area:  Key Measures Citizen perception of trash collection services [annual survey] Citizen perception of residential recycling services [annual   survey] Overall satisfaction of Construction Management’s services  “exceeds” or “meets” expectations Overall satisfaction of facility maintenance and repair services  “exceeds” or “meets” expectations [surveyed quarterly] Overall satisfaction of custodial services contractor “exceeds”  or “meets” ex


            Infrastructure


                 s
                                   Customer Service
                  Categorie
                                       Fleet
                                               Solid Waste
                           Satisfaction Ratings
                  Goal
                 Dept.
                                                    PWT
                                                              PWT
                                  CLA
                                   CLA
                                 CLA
                                CLA
                          AM
                                               AM
                                            AM
                                                  AM
                        AM
                                                      AM
                      AM
                                      AM
                                     AM
                    AM
                                         AM
                                       AM
                             AM
                               IT
                                                             115  PWT  PWT  PWT  Water  Infrastructure Maintenance  Water  Water  Water  Water  Water  Water