
Page 278 - Mansfield 2019 Operating Budget
P. 278
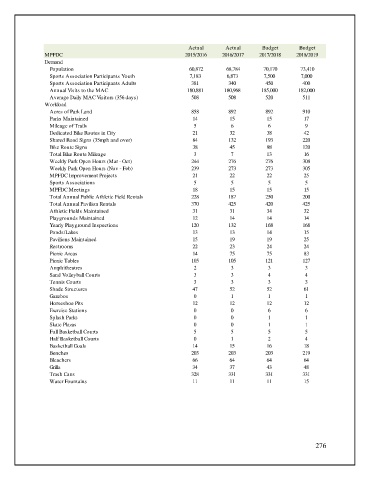
Actual       Actual      Budget      Budget
                MPFDC                                         2015/2016    2016/2017   2017/2018   2018/2019
                Demand
                 Population                                     60,872      68,784      70,170      73,410
                 Sports Association Participants Youth          7,183       6,873       7,500        7,000
                 Sports Association Participants Adults         381          340         450         400
                 Annual Visits to the MAC                      180,881     180,968     185,000      182,000
                 Average Daily MAC Visitors (356 days)          508          508         520         511
                Workload
                 Acres of Park Land                             858          892         892         910
                 Parks Maintained                                14          15          15           17
                 Mileage of Trails                               5           6            6           9
                 Dedicated Bike Routes in City                   21          32          38           42
                 Shared Road Signs (35mph and over)              84          132         193         220
                 Bike Route Signs                                38          45          98          120
                 Total Bike Route Mileage                        3           7           13           16
                 Weekly Park Open Hours (Mar - Oct)             244          276         276         308
                 Weekly Park Open Hours (Nov - Feb)             239          273         273         305
                 MPFDC Improvement Projects                      21          22          22           25
                 Sports Associations                             5           5            5           5
                 MPFDC Meetings                                  18          15          15           15
                 Total Annual Public Athletic Field Rentals     228          187         250         200
                 Total Annual Pavilion Rentals                  370          425         420         425
                 Athletic Fields Maintained                      31          31          34           32
                 Playgrounds Maintained                          12          14          14           14
                 Yearly Playground Inspections                  120          132         168         168
                 Ponds/Lakes                                     13          13          14           15
                 Pavilions Maintained                            15          19          19           25
                 Restrooms                                       22          23          24           24
                 Picnic Areas                                    14          75          75           83
                 Picnic Tables                                  105          105         121         127
                 Amphitheatres                                   2           3            3           3
                 Sand Volleyball Courts                          3           3            4           4
                 Tennis Courts                                   3           3            3           3
                 Shade Structures                                47          52          52           61
                 Gazebos                                         0           1            1           1
                 Horseshoe Pits                                  12          12          12           12
                 Exercise Stations                               0           0            6           6
                 Splash Parks                                    0           0            1           1
                 Skate Plazas                                    0           0            1           1
                 Full Basketball Courts                          5           5            5           5
                 Half Basketball Courts                          0           1            2           4
                 Basketball Goals                                14          15          16           18
                 Benches                                        203          203         203         219
                 Bleachers                                       66          64          64           64
                 Grills                                          34          37          43           48
                 Trash Cans                                     328          331         331         331
                 Water Fountains                                 11          11          11           15


                                                                                                         276