
Page 200 - Mansfield 2019 Operating Budget
P. 200
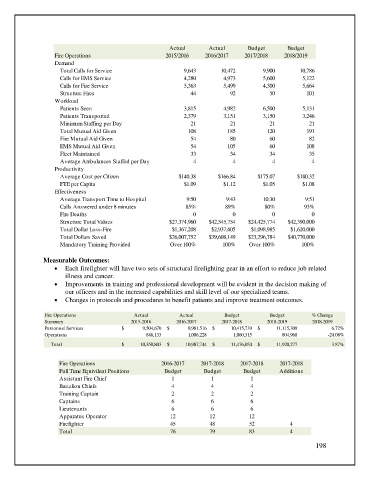
Actual       Actual       Budget       Budget
                   Fire Operations                      2015/2016    2016/2017    2017/2018    2018/2019
                   Demand
                     Total Calls for Service                  9,643       10,472        9,900       10,786
                     Calls for EMS Service                    4,280        4,973        5,600        5,122
                     Calls for Fire Service                   5,363        5,499        4,300        5,664
                     Structure Fires                            44           92           50          101
                   Workload
                     Patients Seen                            3,815        4,982        6,500        5,131
                     Patients Transported                     2,379        3,151        3,150        3,246
                     Minimum Staffing per Day                   21           21           21           21
                     Total Mutual Aid Given                    108          185          120          191
                     Fire Mutual Aid Given                      54           80           60           82
                     EMS Mutual Aid Given                       54          105           60          108
                     Fleet Maintained                           33           34           34           35
                     Average Ambulances Staffed per Day          4            4            4            4
                   Productivity
                     Average Cost per Citizen               $140.38      $166.84      $175.07      $180.32
                     FTE per Capita                           $1.09        $1.12        $1.05        $1.08
                   Effectiveness
                     Average Transport Time to Hospital        9:50         9:43        10:30         9:51
                     Calls Answered under 8 minutes           85%           89%          80%          93%
                     Fire Deaths                                 0            0            0            0
                     Structure Total Values              $27,374,960  $42,545,754  $24,425,774  $42,390,000
                     Total Dollar Loss-Fire               $1,367,208   $2,937,605   $1,098,985   $1,620,000
                     Total Dollars Saved                 $26,007,752  $39,608,149  $23,296,784  $40,770,000
                     Mandatory Training Provided         Over 100%         100%    Over 100%         100%

               Measurable Outcomes:
                   •  Each firefighter will have two sets of structural firefighting gear in an effort to reduce job related
                       illness and cancer.
                   •  Improvements in training and professional development will be evident in the decision making of
                       our officers and in the increased capabilities and skill level of our specialized teams.
                   •  Changes in protocols and procedures to benefit patients and improve treatment outcomes.

                Fire Operations              Actual         Actual         Budget         Budget        % Change
                Summary                     2015-2016      2016-2017      2017-2018      2018-2019      2018-2019

                Personnel Services       $                   9,504,670  $                 9,981,516  $                 10,415,739  $                 11,115,309  6.72%
                Operations                                     846,133                     1,006,228                     1,060,315                          804,968  -24.08%


                  Total                  $               10,350,803  $                 10,987,744  $                 11,476,054  $                 11,920,277  3.87%

                     Fire Operations                  2016-2017    2017-2018     2017-2018    2017-2018
                     Full Time Equivilent Positions    Budget       Budget        Budget     Additions
                     Assistant Fire Chief                 1            1            1
                     Battalion Chiefs                     4            4            4
                     Training Captain                     2            2            2
                     Captains                             6            6            6
                     Lieutenants                          6            6            6
                     Apparatus Operator                  12           12           12
                     Firefighter                         45           48           52            4
                     Total                               76           79           83            4

                                                                                                         198