
Page 195 - Mansfield 2019 Operating Budget
P. 195
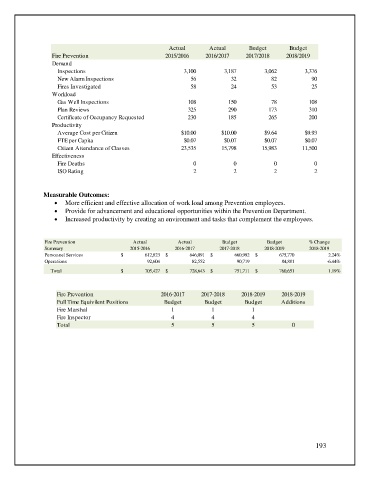
Actual       Actual       Budget        Budget
                  Fire Prevention                       2015/2016    2016/2017    2017/2018     2018/2019
                  Demand
                    Inspections                               3,100        3,187         3,062        3,376
                    New Alarm Inspections                       56           32            82           90
                    Fires Investigated                          58           24            53           25
                  Workload
                    Gas Well Inspections                       108           150           78          108
                    Plan Reviews                               325           290          173          310
                    Certificate of Occupancy Requested         230           185          265          200
                  Productivity
                    Average Cost per Citizen                 $10.00       $10.00         $9.64        $9.93
                    FTE per Capita                            $0.07        $0.07         $0.07        $0.07
                    Citizen Attendance of Classes            23,535       15,798        15,983       11,500
                  Effectiveness
                    Fire Deaths                                  0            0             0            0
                    ISO Rating                                   2            2             2            2


               Measurable Outcomes:
                   •  More efficient and effective allocation of work load among Prevention employees.
                   •  Provide for advancement and educational opportunities within the Prevention Department.
                   •  Increased productivity by creating an environment and tasks that complement the employees.


                Fire Prevention              Actual         Actual         Budget        Budget        % Change
                Summary                     2015-2016      2016-2017      2017-2018     2018-2019      2018-2019
                Personnel Services       $                    612,823  $                    646,091  $                    660,992  $                      675,770  2.24%


                Operations                                       92,604                            82,552                            90,719                            84,881  -6.44%
                  Total                  $                      705,427  $                    728,643  $                    751,711  $                    760,651  1.19%


                    Fire Prevention                   2016-2017     2017-2018    2018-2019    2018-2019
                    Full Time Equivilent Positions     Budget        Budget       Budget      Additions
                    Fire Marshal                          1            1            1
                    Fire Inspector                        4            4            4
                    Total                                 5            5            5             0


                                                                                                         193