
Page 75 - FY 19 Budget Forecast 91218.xlsx
P. 75
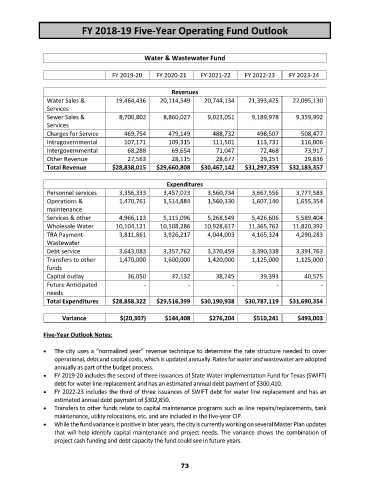
FY 2018‐19 Five‐Year Operating Fund Outlook
Water & Wastewater Fund
FY 2019‐20 FY 2020‐21 FY 2021‐22 FY 2022‐23 FY 2023‐24
Revenues
Water Sales & 19,464,436 20,114,549 20,744,134 21,393,425 22,095,130
Services
Sewer Sales & 8,700,802 8,860,027 9,023,051 9,189,978 9,359,992
Services
Charges for Service 469,754 479,149 488,732 498,507 508,477
Intragovernmental 107,171 109,315 111,501 113,731 116,006
Intergovernmental 68,288 69,654 71,047 72,468 73,917
Other Revenue 27,563 28,115 28,677 29,251 29,836
Total Revenue $28,838,015 $29,660,808 $30,467,142 $31,297,359 $32,183,357
Expenditures
Personnel services 3,356,333 3,457,023 3,560,734 3,667,556 3,777,583
Operations & 1,470,761 1,514,884 1,560,330 1,607,140 1,655,354
maintenance
Services & other 4,966,113 5,115,096 5,268,549 5,426,606 5,589,404
Wholesale Water 10,104,121 10,508,286 10,928,617 11,365,762 11,820,392
TRA Payment‐ 3,811,861 3,926,217 4,044,003 4,165,324 4,290,283
Wastewater
Debt service 3,643,083 3,357,762 3,370,459 3,390,338 3,391,763
Transfers to other 1,470,000 1,600,000 1,420,000 1,125,000 1,125,000
funds
Capital outlay 36,050 37,132 38,245 39,393 40,575
Future Anticipated ‐ ‐ ‐ ‐ ‐
needs
Total Expenditures $28,858,322 $29,516,399 $30,190,938 $30,787,119 $31,690,354
Variance $(20,307) $144,408 $276,204 $510,241 $493,003
Five‐Year Outlook Notes:
The city uses a “normalized year” revenue technique to determine the rate structure needed to cover
operational, debt and capital costs, which is updated annually. Rates for water and wastewater are adopted
annually as part of the budget process.
FY 2019‐20 includes the second of three issuances of State Water Implementation Fund for Texas (SWIFT)
debt for water line replacement and has an estimated annual debt payment of $300,410.
FY 2022‐23 includes the third of three issuances of SWIFT debt for water line replacement and has an
estimated annual debt payment of $302,850.
Transfers to other funds relate to capital maintenance programs such as line repairs/replacements, tank
maintenance, utility relocations, etc. and are included in the five‐year CIP.
While the fund variance is positive in later years, the city is currently working on several Master Plan updates
that will help identify capital maintenance and project needs. The variance shows the combination of
project cash funding and debt capacity the fund could see in future years.
73