
Page 111 - Hurst FY19 Approved Budget
P. 111
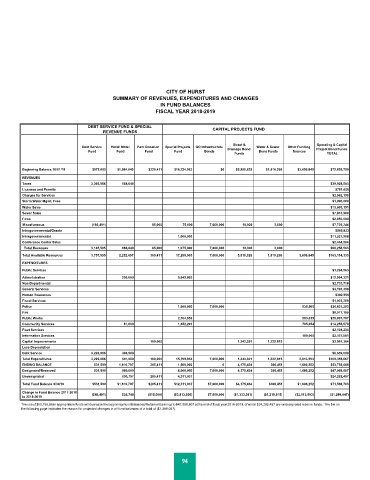
CITY OF HURST
                                      SUMMARY OF REVENUES, EXPENDITURES AND CHANGES
                                                      IN FUND BALANCES
                                                     FISCAL YEAR 2018-2019


                              DEBT SERVICE FUND & SPECIAL              CAPITAL PROJECTS FUND
                                   REVENUE FUNDS
                                                                              Street &                    Operating & Capital
                            Debt Service   Hotel/ Motel    Park Donation   Special Projects   GO Infrastructure   Water & Sewer   Other Funding
                              Fund      Fund     Fund      Fund      Bonds  Drainage Bond   Bond Funds  Sources  Project Bond Funds
                                                                               Funds                         TOTAL
        Beginning Balance 10/01/18  $572,000  $1,584,049  $220,411  $16,224,963  $0  $5,508,825  $1,616,266  $3,699,845  $72,855,750
        REVENUES
        Taxes                  3,366,086  668,648                                                             $39,928,583
        Licenses and Permits                                                                                    $781,000
        Charges for Services                                                                                   $2,062,150
        Storm Water Mgmt. Fees                                                                                 $1,090,000
        Water Sales                                                                                           $13,605,151
        Sewer Sales                                                                                            $7,851,960
        Fines                                                                                                  $2,850,000
        Miscellaneous          (180,491)           85,000    75,000   7,000,000  10,000     3,000              $7,729,244
        Intergovernmental/Grants                                                                                $566,923
        Intragovernmental                                   1,000,000                                         $11,327,908
        Conference Center Sales                                                                                $2,464,564
          Total Revenues       3,185,595  668,648  85,000   1,075,000  7,000,000  10,000    3,000             $90,258,583
        Total Available Resources  3,757,595  2,252,697  305,411  17,299,963  7,000,000  5,518,825  1,619,266  3,699,845  $163,114,333
        EXPENDITURES
        Public Services                                                                                        $1,204,563
        Administration                   200,000            9,642,803                                         $12,904,321
        Non-Departmental                                                                                       $2,733,718
        General Services                                                                                       $3,193,398
        Human Resources                                                                                         $392,558
        Fiscal Services                                                                                        $1,023,209
        Police                                              1,800,000  7,000,000                     535,500  $26,831,293
        Fire                                                                                                   $8,577,185
        Public Works                                        2,704,959                                583,039  $25,897,787
        Community Services                81,000            1,652,201                                795,054  $14,255,570
        Fleet Services                                                                                         $2,138,235
        Information Services                                                                         100,000   $2,467,581
        Capital Improvements                       100,000                      1,343,391  1,222,815           $3,991,364
        Less Depreciation
        Debt Service           3,226,086  360,900                                                              $6,559,599
        Total Expenditures     3,226,086  641,900  100,000  15,799,963  7,000,000  1,343,391  1,222,815  2,013,593  $109,358,667
        ENDING BALANCE          531,509  1,610,797  205,411  1,500,000     0    4,175,434  396,451  1,686,252  $53,755,666
        Designated/Reserved     531,509  980,000            8,000,000  7,000,000  4,175,434  396,451  1,686,252  $47,098,807
        Undesignated                     630,797   205,411  4,311,037                                         $24,282,497
        Total Fund Balance 9/30/19  $531,509  $1,610,797  $205,411  $12,311,037  $7,000,000  $4,175,434  $396,451  $1,686,252  $71,566,703
        Change in Fund Balance 2017-2018
        to 2018-2019           ($40,491)  $26,748   ($15,000)  ($3,913,926)  $7,000,000   ($1,333,391)  ($1,219,815)  ($2,013,593)  ($1,289,047)
        The use of $53,755,66 in appropriable funds will decrease the beginning Fund Balances/Retained Earnings to $47,098,807 at the end of fiscal year 2018-2019, of which $24,282,497 are undesignated reserve funds. The ble on
        the following page indicates the reason for projected changes in all fund balances of a total of ($1,289,047).


                                                             94