
Page 107 - Hurst FY19 Approved Budget
P. 107
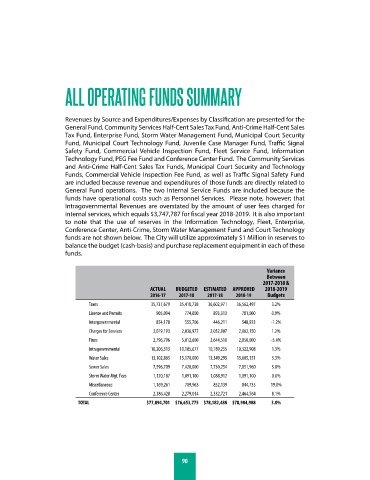
ALL OPERATING FUNDS SUMMARY


                       Revenues by Source and Expenditures/Expenses by Classification are presented for the
                       General Fund, Community Services Half-Cent Sales Tax Fund, Anti-Crime Half-Cent Sales
                       Tax Fund, Enterprise Fund, Storm Water Management Fund, Municipal Court Security
                       Fund, Municipal Court Technology Fund, Juvenile Case Manager Fund, Traffic Signal
                       Safety Fund, Commercial  Vehicle Inspection Fund, Fleet Service Fund, Information
                       Technology Fund, PEG Fee Fund and Conference Center Fund.  The Community Services
                       and Anti-Crime Half-Cent Sales Tax Funds, Municipal Court Security and Technology
                       Funds, Commercial Vehicle Inspection Fee Fund, as well as Traffic Signal Safety Fund
                       are included because revenue and expenditures of those funds are directly related to
                       General Fund operations.  The two Internal Service Funds are included because the
                       funds have operational costs such as Personnel Services.  Please note, however; that
                       Intragovernmental Revenues are overstated by the amount of user fees charged for
                       internal services, which equals $3,747,787 for fiscal year 2018-2019.  It is also important
                       to note that the use of reserves in the Information  Technology, Fleet, Enterprise,
                       Conference Center, Anti-Crime, Storm Water Management Fund and Court Technology
                       funds are not shown below.  The City will utilize approximately $1 Million in reserves to
                       balance the budget (cash-basis) and purchase replacement equipment in each of these
                       funds.


                                                                                         Variance
                                                                                         Between
                                                                                        2017-2018 &
                                                   ACTUAL  BUDGETED  ESTIMATED  APPROVED  2018-2019
                                                   2016-17  2017-18   2017-18  2018-19   Budgets
                              Taxes                35,737,679  35,418,738  36,602,971  36,562,497  3.2%
                              License and Permits    905,094  774,000   893,313  781,000   0.9%
                              Intergovernmental      854,178  555,706   446,211  548,923   -1.2%
                              Charges for Services  2,019,193  2,036,977  2,052,907  2,062,150  1.2%
                              Fines                 2,796,796  3,012,600  2,644,510  2,850,000  -5.4%
                              Intragovernmental    10,206,313  10,185,677  10,189,255  10,322,908  1.3%
                              Water Sales          13,102,863  13,170,000  13,349,295  13,605,151  3.3%
                              Sewer Sales           7,596,709  7,420,000  7,730,254  7,851,960  5.8%
                              Storm Water Mgt. Fees  1,120,187  1,091,100  1,088,912  1,091,100  0.0%
                              Miscellaneous         1,169,261  709,963  852,139  844,735   19.0%
                              Conference Center     2,386,428  2,279,014  2,332,721  2,464,564  8.1%
                           TOTAL                  $77,894,701 $76,653,775 $78,182,488 $78,984,988  3.0%


                                                             90