Page 109 - Hurst FY19 Approved Budget
P. 109

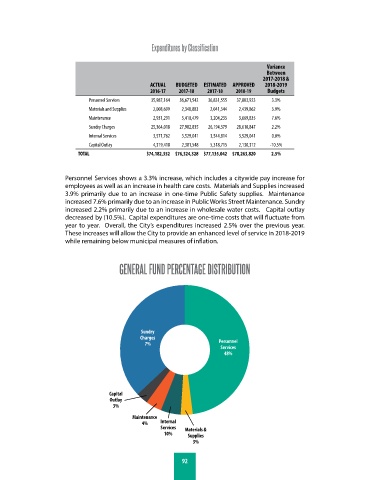
Expenditures by Classification


                                                                                         Variance
                                                                                         Between
                                                                                        2017-2018 &
                                                   ACTUAL  BUDGETED  ESTIMATED  APPROVED  2018-2019
                                                   2016-17  2017-18   2017-18  2018-19   Budgets
                              Personnel Services   35,987,164  36,671,542  36,831,555  37,883,923  3.3%
                              Materials and Supplies  2,008,699  2,348,883  2,041,344  2,439,862  3.9%
                              Maintenance           2,931,291  3,410,479  3,204,235  3,669,835  7.6%
                              Sundry Charges       25,364,018  27,982,835  26,194,379  28,610,847  2.2%
                              Internal Services     3,571,762  3,529,041  3,544,814  3,529,041  0.0%
                              Capital Outlay        4,319,418  2,381,548  5,318,715  2,130,312  -10.5%
                           TOTAL                  $74,182,352 $76,324,328 $77,135,042 $78,263,820  2.5%


                       Personnel Services shows a 3.3% increase, which includes a citywide pay increase for
                       employees as well as an increase in health care costs.  Materials and Supplies increased
                       3.9% primarily due to an increase in one-time Public Safety supplies.  Maintenance
                       increased 7.6% primarily due to an increase in Public Works Street Maintenance. Sundry
                       increased 2.2% primarily due to an increase in wholesale water costs.   Capital outlay
                       decreased by (10.5%).  Capital expenditures are one-time costs that will fluctuate from
                       year to year.  Overall, the City’s expenditures increased 2.5% over the previous year.
                       These increases will allow the City to provide an enhanced level of service in 2018-2019
                       while remaining below municipal measures of inflation.
                                      �


                                         GENERAL FUND PERCENTAGE DISTRIBUTION


                                                Sundry                                 � � � � � � � � � � � �
                                               Charges                   Personnel
                                                 7%
                                                                          Services
                                                                           48%


                                     Capital
                                     Outlay
                                      3%
                                             Maintenance
                                                4%    Internal
                                                      Services  Materials &
                                                       10%     Supplies
                                                                 3%


                                                             92
   104   105   106   107   108   109   110   111   112   113   114