
Page 110 - Hurst FY19 Approved Budget
P. 110
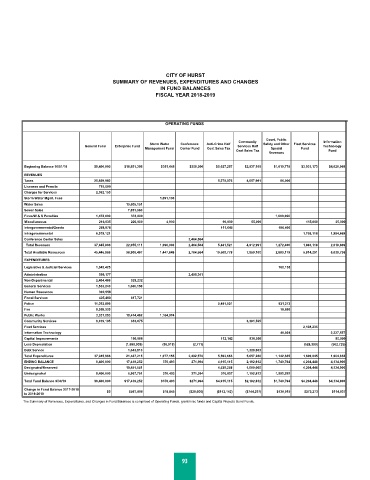
CITY OF HURST
                                      SUMMARY OF REVENUES, EXPENDITURES AND CHANGES
                                                      IN FUND BALANCES
                                                     FISCAL YEAR 2018-2019


                                                        OPERATING FUNDS

                                                                                         Court, Public
                                                                                Community                   Information
                                                   Storm Water   Conference   Anti-Crime Half   Safety and Other   Fleet Services
                             General Fund  Enterprise Fund                      Services Half               Technology
                                                 Management Fund  Center Fund  Cent Sales Tax  Cent Sales Tax  Special   Fund  Fund
                                                                                          Revenues
         Beginning Balance 10/01/18  $8,400,000  $16,851,356  $351,648  $300,000   $5,027,257  $2,937,109  $1,610,779  $3,931,173  $4,020,069
         REVENUES
         Taxes                  25,669,982                               5,279,876  4,857,991  86,000
         Licenses and Permits     781,000
         Charges for Services    2,062,150
         Storm Water Mgmt. Fees                       1,091,100
         Water Sales                       13,605,151
         Sewer Sales                       7,851,960
         Fines/W & S Penalties   1,472,000  378,000                                         1,000,000
         Miscellaneous            216,835   220,000     4,900              90,000   55,000            115,000   35,000
         Intergovernmental/Grants  268,878                                111,645            186,400
         Intragovernmental       6,575,121                                                           1,768,118  1,984,669
         Conference Center Sales                               2,464,564
           Total Revenues       37,045,966  22,055,111  1,096,000  2,464,564  5,481,521  4,912,991  1,272,400  1,883,118  2,019,669
         Total Available Resources  45,445,966  38,906,467  1,447,648  2,764,564  10,508,778  7,850,100  2,883,179  5,814,291  6,039,738
         EXPENDITURES
         Legislative & Judicial Services  1,042,425                                          162,138
         Administration           566,177                      2,495,341
         Non-Departmental        2,404,486  329,232
         General Services        1,533,240  1,660,158
         Human Resources          392,558
         Fiscal Services          405,488   617,721
         Police                 11,092,899                               5,481,521           921,373
         Fire                    8,558,335                                                    18,850
         Public Works            3,031,253  18,414,462  1,164,074
         Community Services      8,019,105  316,675                                3,391,535
         Fleet Services                                                                              2,138,235
         Information Technology                                                               40,024          2,327,557
         Capital Improvements               196,066                       112,142   936,950                     80,000
         Less Depreciation                 (1,690,909)  (86,919)  (2,771)                             (528,390)  (502,725)
         Debt Service                      1,643,810                               1,328,803
         Total Expenditures     37,045,966  21,487,215  1,077,155  2,492,570  5,593,663  5,657,288  1,142,385  1,609,845  1,904,832
         ENDING BALANCE          8,400,000  17,419,252  370,493  271,994  4,915,115  2,192,812  1,740,794  4,204,446  4,134,906
         Designated/Reserved               10,451,551                    4,538,258  1,000,000        4,204,446  4,134,906
         Undesignated            8,400,000  6,967,701  370,493  271,994   376,857  1,192,812  1,555,395
         Total Fund Balance 9/30/19  $8,400,000  $17,419,252  $370,493  $271,994   $4,915,115   $2,192,812  $1,740,794   $4,204,446  $4,134,906
         Change in Fund Balance 2017-2018   $0  $567,896   $18,845   ($28,006)  ($112,142)  ($744,297)  $130,015   $273,273   $114,837
         to 2018-2019
         The Summary of Revenues, Expenditures, and Changes in Fund Balances is comprised of Operating Funds, grant/misc funds and Capital Projects Bond Funds.


                                                             93