
Page 176 - Grapevine FY19 Operating Budget
P. 176
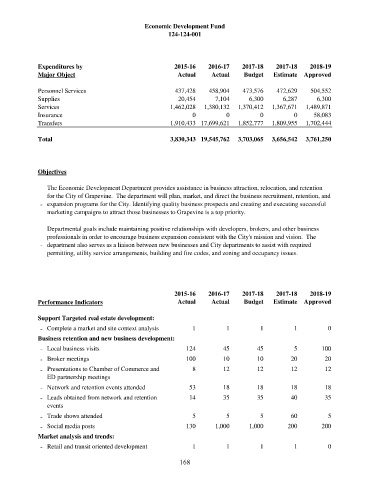
Economic Development Fund
                                                      124-124-001


           Expenditures by                              2015-16     2016-17    2017-18    2017-18    2018-19
           Major Object                                  Actual      Actual    Budget    Estimate  Approved

           Personnel Services                            437,428    458,904    473,576    472,629    504,552
           Supplies                                       20,454      7,104      6,300      6,287      6,300
           Services                                    1,462,028  1,380,132  1,370,412   1,367,671  1,489,871
           Insurance                                          0           0          0          0     58,083
           Transfers                                   1,910,433 17,699,621  1,852,777   1,809,955  1,702,444

           Total                                       3,830,343 19,545,762  3,703,065   3,656,542  3,761,250


           Objectives

              The Economic Development Department provides assistance in business attraction, relocation, and retention
              for the City of Grapevine.  The department will plan, market, and direct the business recruitment, retention, and
            - expansion programs for the City. Identifying quality business prospects and creating and executing successful
              marketing campaigns to attract those businesses to Grapevine is a top priority.


              Departmental goals include maintaining positive relationships with developers, brokers, and other business
              professionals in order to encourage business expansion consistent with the City's mission and vision.  The
            - department also serves as a liaison between new businesses and City departments to assist with required
              permitting, utility service arrangements, building and fire codes, and zoning and occupancy issues.


                                                        2015-16     2016-17    2017-18    2017-18    2018-19
           Performance Indicators                        Actual      Actual    Budget    Estimate  Approved

           Support Targeted real estate development:
            - Complete a market and site context analysis     1           1          1          1          0
                                 d
                          i
                 185
           Business retention and new business development:
            - Local business visits                         124         45          45          5        100
            - Broker meetings                               100         10          10         20         20
            - Presentations to Chamber of Commerce and        8         12          12         12         12
              ED partnership meetings
            - Network and retention events attended          53         18          18         18         18

            - Leads obtained from network and retention      14         35          35         40         35
              events
            - Trade shows attended                            5           5          5         60          5
            - Social media posts                            130       1,000      1,000        200        200

           Market analysis and trends:
            - Retail and transit oriented development         1           1          1          1          0
                 d
                                                          168