
Page 131 - Grapevine FY19 Operating Budget
P. 131
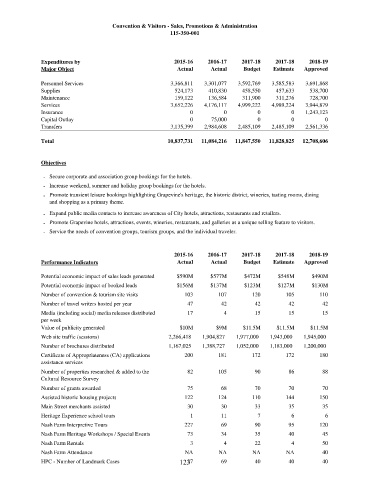
Convention & Visitors - Sales, Promotions & Administration
                                                       115-350-001


            Expenditures by                             2015-16    2016-17     2017-18    2017-18    2018-19
            Major Object                                 Actual     Actual     Budget    Estimate  Approved

            Personnel Services                         3,366,811  3,301,077  3,592,769   3,585,583  3,691,868
            Supplies                                    524,173     410,830    458,550    457,633    538,700
            Maintenance                                 159,122     136,584    311,900    311,276    728,700
            Services                                   3,652,226  4,176,117  4,999,222   4,989,224  3,944,879
            Insurance                                         0          0          0          0    1,243,123
            Capital Outlay                                    0      75,000         0          0          0
            Transfers                                  3,135,399  2,984,608  2,485,109   2,485,109  2,561,336

            Total                                     10,837,731  11,084,216  11,847,550  11,828,825  12,708,606


            Objectives

             - Secure corporate and association group bookings for the hotels.
             - Increase weekend, summer and holiday group bookings for the hotels.
             - Promote transient leisure bookings highlighting Grapevine's heritage, the historic district, wineries, tasting rooms, dining
               and shopping as a primary theme.

             - Expand public media contacts to increase awareness of City hotels, attractions, restaurants and retailers.
             - Promote Grapevine hotels, attractions, events, wineries, restaurants, and galleries as a unique selling feature to visitors.
             - Service the needs of convention groups, tourism groups, and the individual traveler.


                                                        2015-16    2016-17     2017-18    2017-18    2018-19
            Performance Indicators                       Actual     Actual     Budget    Estimate  Approved

            Potential economic impact of sales leads generated   $590M  $577M  $472M       $548M      $490M
            Potential economic impact of booked leads        $156M  $137M      $123M       $127M      $130M
            Number of convention & tourism site visits      103        107        120        105        110
            Number of travel writers hosted per year         47         42         42         42         42
            Media (including social) media releases distributed   17     4         15         15         15
            per week
            Value of publicity generated                  $10M        $9M            $11.5M  $11.5M  $11.5M
            Web site traffic (sessions)                   2,266,418         1,904,827         1,977,000         1,943,000       1,945,000


            Number of brochures distributed                 1,167,025         1,388,727       1,052,000         1,183,000         1,200,000
            Certificate of Appropriateness (CA) applications   200     181        172        172        180
            assistance services
            Number of properties researched & added to the   82        105         90         86         88
            Cultural Resource Survey
            Number of grants awarded                         75         68         70         70         70
            Assisted historic housing projects              122        124        110        144        150
            Main Street merchants assisted                   30         30         33         35         35
            Heritage Experience school tours                  1         11          7          6          6
            Nash Farm Interpretive Tours                    227         69         90         95        120
            Nash Farm Heritage Workshops / Special Events    73         34         35         40         45
            Nash Farm Rentals                                 3          4         22          4         50
            Nash Farm Attendance                            NA         NA         NA         NA          40
            HPC - Number of Landmark Cases                123           69         40         40         40
                                                             37