
Page 102 - Grapevine FY19 Operating Budget
P. 102
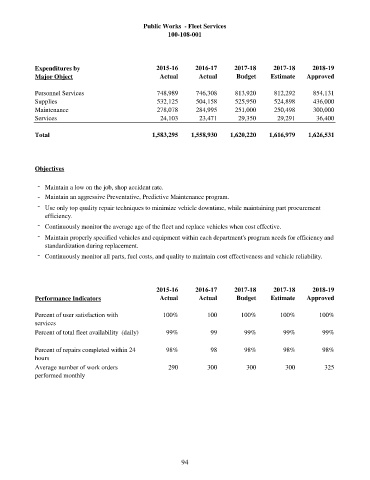
Public Works  - Fleet Services
                                                      100-108-001


          Expenditures by                         2015-16      2016-17      2017-18      2017-18      2018-19
          Major Object                             Actual       Actual       Budget     Estimate    Approved


          Personnel Services                       748,989     746,308      813,920      812,292      854,131
          Supplies                                 532,125     504,158      525,950      524,898      436,000
          Maintenance                              278,078     284,995      251,000      250,498      300,000
          Services                                  24,103       23,471      29,350       29,291       36,400

          Total                                  1,583,295    1,558,930    1,620,220    1,616,979    1,626,531


          Objectives


           - Maintain a low on the job, shop accident rate.
           - Maintain an aggressive Preventative, Predictive Maintenance program.
           -  Use only top quality repair techniques to minimize vehicle downtime, while maintaining part procurement
              efficiency.
           - Continuously monitor the average age of the fleet and replace vehicles when cost effective.
           -  Maintain properly specified vehicles and equipment within each department's program needs for efficiency and
              standardization during replacement.
           - Continuously monitor all parts, fuel costs, and quality to maintain cost effectiveness and vehicle reliability.


                                                  2015-16      2016-17      2017-18      2017-18      2018-19
          Performance Indicators                   Actual       Actual       Budget     Estimate    Approved

          Percent of user satisfaction with          100%          100        100%         100%         100%
          services
          Percent of total fleet availability  (daily)  99%         99         99%          99%          99%


          Percent of repairs completed within 24      98%           98         98%          98%          98%
          hours
          Average number of work orders               290          300          300          300          325
          performed monthly


                                                           94