
Page 99 - Fort Worth City Budget 2019
P. 99
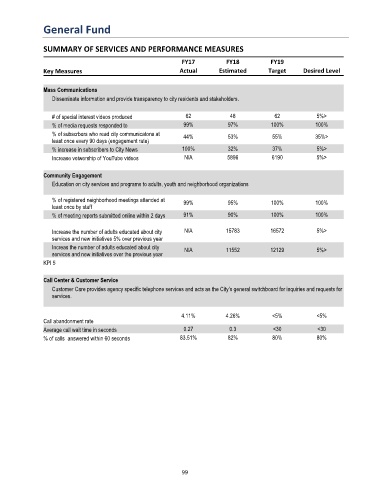
General Fund


               SUMMARY OF SERVICES AND PERFORMANCE MEASURES

                                                             FY17           FY18           FY19
               Key Measures                                 Actual       Estimated        Target     Desired Level


               Mass Communications
                  Disseminate information and provide transparency to city residents and stakeholders.

                  # of special interest videos produced       62             48             62            5%>
                  % of media requests responded to            99%           97%            100%          100%
                  % of subscrbers who read city communicatons at   44%      53%            55%           35%>
                  least once every 90 days (engagement rate)
                  % increase in subscribers to City News     100%           32%            37%            5%>
                  Increase veiwership of YouTube videos       N/A           5896           6190           5%>


               Community Engagement
                  Education on city services and programs to adults, youth and neighborhood organizations

                  % of registered neighborhood meetings attended at   99%   95%            100%          100%
                  least once by staff
                  % of meeting reports submitted online within 2 days  91%  90%            100%          100%

                  Increase the number of adults educated about city   N/A   15783         16572           5%>
                  services and new initiatives 5% over previous year
                  Increas the number of adults educated about city   N/A    11552         12129           5%>
                  services and new initiatives over the previous year
               KPI 5

               Call Center & Customer Service
                  Customer Care provides agency specific telephone services and acts as the City’s general switchboard for inquiries and requests for
                  services.


                                                             4.11%          4.26%          <5%            <5%
               Call abandonment rate
               Average call wait time in seconds              0.27           0.3           <30            <30
               % of calls  answered within 60 seconds        83.51%         82%            80%            80%


                                                             99