
Page 278 - Fort Worth City Budget 2019
P. 278
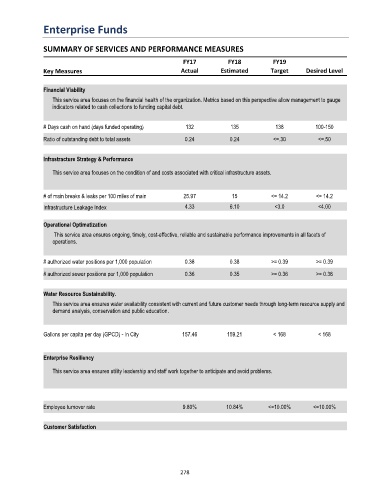
Enterprise Funds


               SUMMARY OF SERVICES AND PERFORMANCE MEASURES

                                                              FY17          FY18           FY19
               Key Measures                                  Actual       Estimated        Target     Desired Level


               Financial Viability
                  This service area focuses on the financial health of the organization. Metrics based on this perspective allow management to gauge
                  indicators related to cash collections to funding capital debt.


               # Days cash on hand (days funded operating)    132            135            138          100-150
               Ratio of outstanding debt to total assets      0.24           0.24          <=.30          <=.50


               Infrastracture Strategy & Performance

                  This service area focuses on the condition of and costs associated with critical infrastructure assets.


               # of main breaks & leaks per 100 miles of main  25.97          15           <= 14.2        <= 14.2
               Infrastructure Leakage Index                   4.33           6.10           <3.0          <4.00


               Operational Optimatization
                   This service area ensures ongoing, timely, cost-effective, reliable and sustainable performance improvements in all facets of
                  operations.


               # authorized water positions per 1,000 population  0.38       0.38          >= 0.39        >= 0.39

               # authorized sewer positions per 1,000 population  0.36       0.35          >= 0.36        >= 0.36


               Water Resource Sustainability.
                  This service area ensures water availability consistent with current and future customer needs through long-term resource supply and
                  demand analysis, conservation and public education.


               Gallons per capita per day (GPCD) - In City   157.46         159.21         < 168          < 168


               Enterprise Resiliency

                  This service area ensures utility leadership and staff work together to anticipate and avoid problems.


               Employee turnover rate                        9.80%          10.84%        <=10.00%       <=10.00%


               Customer Satisfaction


                                                             278