
Page 53 - Microsoft Word - Budget FY 19
P. 53
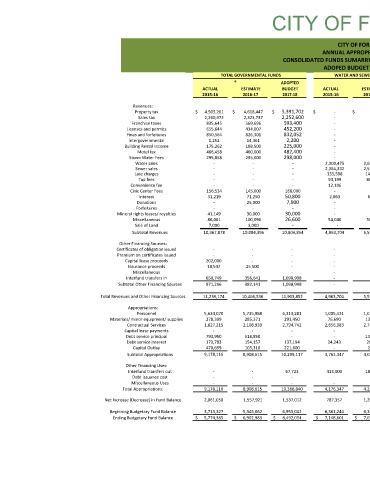
CITY OF FOREST HILL
                CITY OF FOREST HILL  ANNUAL APPROPRIATED FUNDS     CONSOLIDATED FUNDS SUMARRY (MODIFIED ACCRUAL BASIS)     ADOPED BUDGET FY 2018‐2019      TOTAL  WATER AND SEWER OPERATING FUND                                 ADOPTED         *                  ADOPTED                     BUDGET         ESTIMATE         ACTUAL         BUDGET         ESTIMATE                                             2017‐18   2016‐17   2015‐16   2017‐18   2016‐17            5,391,702   $   4,618,447   $   4,505,261   $   ‐   $   ‐   $         2,252,600      2,323,737      2,260,972   ‐       ‐          593,400       569,696       835,645   ‐


                                   ACTUAL         2015‐16   ‐   ‐   ‐   ‐   ‐   ‐   ‐   ‐   ‐   2,300,475   2,364,332   135,598   94,199   12,196   ‐   2,863   ‐   ‐   ‐   54,040   ‐   4,963,704   ‐   ‐   ‐   ‐   ‐   ‐   ‐   4,963,704   1,005,431   76,690   2,656,983   ‐   ‐   24,243   ‐   3,763,347   413,000   ‐   4,176,347   787,357   6,361,244   7,148,601   $
                                      $

                             ADOPTED      BUDGET         2017‐18   5,391,702   $   2,252,600       593,400       452,200       832,052       2,200       225,000       482,400       298,000       ‐       ‐       ‐       ‐       ‐       160,000       50,800       7,900       ‐       30,000       26,600       ‐          10,804,854   ‐       ‐       ‐       ‐       ‐   1,098,998           1,098,998   11,903,852   6,313,281       293,450       2,794,742       ‐           ‐   137,194       221,600       10,299,117       67,723       ‐       ‐       10,366,840           1,537,012       6,955,042   8,492,054   $


                          TOTAL GOVERNMENTAL FUNDS         *      ESTIMATE            2016‐17   4,618,447   $   2,323,737       569,696       434,007       826,301       14,361       188,500       460,000       295,000       ‐       ‐   ‐   ‐       ‐       145,000       71,250       25,000       ‐       30,000       100,096       3,000       10,084,395   ‐   ‐   ‐   25,500   ‐   356,641   382,141   10,466,536   5,735,988   285,371   2,108,939   ‐   518,850   154,157   105,310   8,908,615   ‐   ‐   ‐   8,908,615       1,557,921       5,345,062     6,902,983   $


                               ACTUAL   2015‐16
                                         4,505,261   2,260,972   835,645   655,644   850,564   1,252   175,262   466,458   295,858   ‐   ‐   ‐   ‐   ‐   156,534   31,219   ‐   ‐   41,149   86,061   7,000   10,367,878       ‐       ‐       202,000       18,547   ‐       650,749       871,296   11,239,174      5,634,070       278,399      1,827,215       ‐       793,950       173,783       470,699   9,178,116          ‐       ‐       ‐   9,178,116   2,061,058      3,713,327     5,774,385

                                      $                                                                                                     $


                                     Revenues:   Property tax   Sales tax   Franchise taxes   Licenses and permits   Fines and forfeitures   Intergovernmental   Building Rental Income   Motel tax   Storm Water Fees   Water sales   Sewer sales   Late charges   Tap fees   Convenience fee   Civic Center Fees   Interest   Donations   Forfeitures   Mineral rights leases/ royalties   Miscellaneous   Sale of Land   Subtotal Revenues   Certificates of obligation issued   Premium on certificates issued   Capital lease proceeds   Insurance proceeds   Miscellaneous   Interfund transfers in   Subtotal Other Financing Sources   Total Rev

                                                                                  Other Financing Sources:                        Total Appropriations:   Net Increase (Decrease) in Fund Balance   Ending Budgetary Fund Balance