
Page 51 - Microsoft Word - Budget FY 19
P. 51
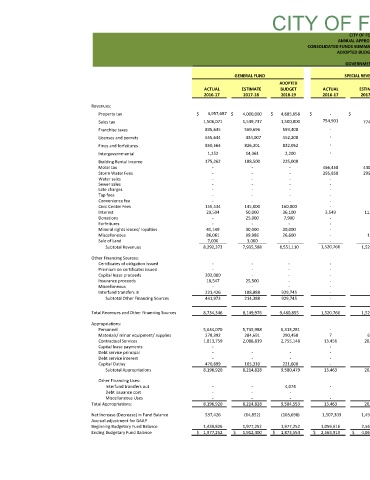
CITY OF FOREST HILL  CITY OF FOREST HILL   ANNUAL APPROPRIATED FUNDS  CONSOLIDATED FUNDS SUMMARY (MODIFIED ACCRUAL BASIS)   ADIOPTED BUDGET FY 2018‐2019      GOVERNMENTAL FUNDS   CAPITAL PROJECTS FUND  DEBT SERVICE FUND    SPECIAL REVENUE FUNDS                        ADOPTED                               ADOPTED                           ADOPTED               BUDGET     ESTIMATE           ACTUAL         BUDGET     ESTIMATE         ACTUAL         BUDGET        ESTIMATE      2017‐18            2016‐17            2015‐16         2017‐18         2016‐17         2015‐16         2018‐19         2017‐18


                               ACTUAL                           2016‐17       ‐   754,901       ‐       ‐       ‐       ‐                  466,458       295,858       ‐       ‐       ‐       ‐       ‐       ‐       3,549       ‐       ‐       ‐       ‐       ‐      1,520,766              ‐       ‐       ‐       ‐       ‐       ‐       ‐      1,520,766       ‐       7       13,456       ‐       ‐       ‐       ‐       13,463               ‐      -       13,463   1,507,303       1,056,616      2,563,919


                                                                                                                                                $

                                       $


                             ADOPTED   BUDGET   2018‐19   4,685,658   1,500,000   593,400   452,200   832,052   2,200   225,000   ‐   ‐   ‐   ‐   ‐   ‐   ‐   160,000   36,100   7,900   ‐   30,000   26,600   ‐   8,551,110   ‐   ‐   ‐   ‐   ‐   929,745   929,745   9,480,855   6,313,281   290,450   2,755,148      ‐   ‐   221,600   9,580,479      4,074   -  -   9,584,553   (103,698)   1,977,252   1,873,554


                                                                                                                                                $
                                                      $
                          GENERAL FUND    ESTIMATE   2017‐18   4,000,000   1,549,737   569,696   434,007   826,301   14,361   188,500   ‐   ‐   ‐   ‐   ‐   ‐   ‐   145,000   50,000   25,000   ‐   30,000   99,986   3,000   7,935,588   ‐   ‐   ‐   25,500   ‐   188,888   214,388   8,149,976   5,735,988   284,691   2,088,839      ‐   ‐   105,310   8,214,828      ‐   -  -   8,214,828   (64,852)   1,977,252   1,912,400


                                               $                                                                                                                                               $

                               ACTUAL   2016‐17   3,957,687  1,506,071   835,645   655,644   850,564   1,252   175,262   ‐   ‐   ‐   ‐   ‐   ‐   ‐   156,534   20,504  ‐   ‐   41,149   86,061   7,000   8,292,373   ‐   ‐   202,000   18,547   ‐   221,426   441,973   8,734,346   5,634,070   278,392   1,813,759   ‐   ‐   ‐   470,699   8,196,920      ‐   -  ‐   8,196,920   537,426      1,439,826   1,977,252


                                       $                                                                                                        $


                                    Revenues:   Property tax   Sales tax   Franchise taxes   Licenses and permits   Fines and forfeitures   Intergovernmental   Building Rental Income   Motel tax   Storm Water Fees   Water sales   Sewer sales   Late charges   Tap fees   Convenience fee   Civic Center Fees   Interest   Donations   Forfeitures   Mineral rights leases/ royalties   Miscellaneous   Sale of Land   Subtotal Revenues   Other Financing Sources:   Certificates of obligation issued   Premium on certificates issued   Capital lease proceeds   Insurance proceeds   Miscellaneous   Interfund transfers in   Subtotal Other Fin