Page 74 - Colleyville FY19 Budget
P. 74

utilization of monthly performance metrics to measure and analyze what we are doing
                       correctly and see where we may have better internal and external opportunities will
                       be a constant.


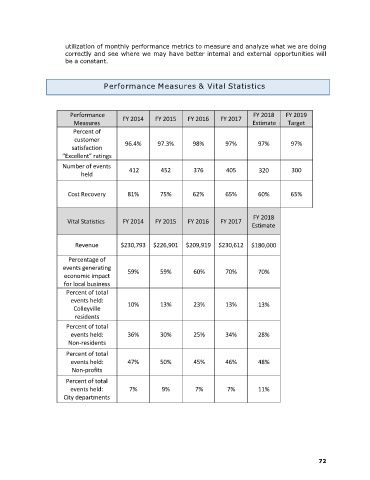
                                   Performance Measures & Vital Statistics


                        Performance       FY 2014   FY 2015    FY 2016    FY 2017     FY 2018      FY 2019
                         Measures                                                    Estimate    e    Target
                         Percent of
                          customer        96.4%      97.3%       98%        97%       97%        97%
                         satisfaction
                      “Excellent” ratings
                      Number of events      412       452        376        405        320       300
                            held

                       Cost Recovery       81%        75%        62%        65%       60%        65%


                       Vital Statistics   FY 2014   FY 2015    FY 2016    FY 2017    FY 2018
                                                                                    Estimate


                          Revenue        $230,793  $226,901  $209,919  $230,612  $180,000

                        Percentage of
                      events generating    59%        59%        60%        70%
                      economic impact                                                 70%
                      for local business
                       Percent of total
                        events held:
                         Colleyville       10%        13%        23%        13%       13%
                          residents
                       Percent of total
                        events held:       36%        30%        25%        34%       28%
                        Non-residents
                       Percent of total
                        events held:       47%        50%        45%        46%       48%
                         Non-profits

                       Percent of total
                        events held:        7%         9%         7%        7%        11%
                      City departments


                                                                                                          72
   69   70   71   72   73   74   75   76   77   78   79