Page 146 - Colleyville FY19 Budget
P. 146

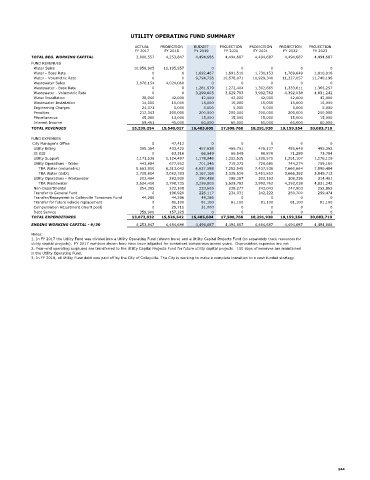
UTILITY OPERATING FUND SUMMARY


                                                                              ACTUAL         PROJECTION         BUDGET        PROJECTION       PROJECTION       PROJECTION       PROJECTION
                                                                              FY 2017          FY 2018          FY 2019          FY 2020          FY 2021          FY 2022          FY 2023

                   TOTAL BEG. WORKING CAPITAL                                  3,800,557        4,253,847        4,494,686        4,494,687       4,494,687        4,494,687        4,494,687
                   FUND REVENUES
                     Water Sales                                             10,958,905       11,195,957                  0                0                0               0                0
                     Water - Base Rate                                                  0                0       1,692,467        1,691,510       1,730,153        1,769,649        1,810,016
                     Water - Volumetric Rate                                            0                0       9,794,756      10,578,071       10,929,340       11,327,057       11,740,196
                     Wastewater Sales                                          3,876,154        4,024,060                 0                0                0               0                0
                     Wastewater - Base Rate                                             0                0       1,281,579        1,272,404       1,302,665        1,333,611        1,365,257
                     Wastewater - Volumetric Rate                                       0                0       3,299,803        3,629,783       3,992,762        4,392,038        4,831,242
                     Water Installation                                           38,940           42,000           42,000           42,000           42,000           42,000           42,000
                     Wastewater Installation                                      14,000           15,000           15,000           15,000           15,000           15,000           15,000
                     Engineering Charges                                          24,071            5,000            5,000            5,000            5,000            5,000            5,000
                     Penalties                                                   212,343          200,000          200,000         200,000          200,000          200,000          200,000
                     Miscellaneous                                                45,380           13,000           15,000           15,000           15,000           15,000           15,000
                     Interest Income                                              69,461           45,000           60,000           60,000           60,000           60,000           60,000
                   TOTAL REVENUES                                           15,239,254       15,540,017       16,405,605       17,508,768       18,291,920       19,159,354       20,083,710

                   FUND EXPENSES
                    City Manager's Office                                               0          47,412                 0                0                0               0                0
                     Utility Billing                                             395,364          433,425          457,638         466,791          476,127          485,649          495,362
                     IS GIS                                                             0          63,316           66,549           66,549           68,878           71,289           73,784
                     Utility Support                                           1,173,538        1,124,497        1,178,946        1,202,525       1,226,575        1,251,107        1,276,129
                     Utility Operations - Water                                  443,884          677,952          701,346         715,373          729,681          744,274          759,160
                        TRA Water (volumetric)                                 5,663,950        6,313,042        6,627,588        7,252,545       7,437,538        7,660,664        7,890,484
                        TRA Water (debt)                                       2,709,814        3,052,783        3,167,168        3,325,526       3,491,802        3,666,392        3,849,712
                     Utility Operations - Wastewater                             202,484          283,930          290,458         296,267          302,193          308,236          314,401
                        TRA Wastewater                                         2,624,416        2,798,735        3,299,803        3,629,783       3,992,762        4,392,038        4,831,242
                     Non-Departmental                                            254,395          222,108          233,605         238,277          243,043          247,903          252,862
                     Transfer to General Fund                                           0         196,920          226,117         234,031          242,222          250,700          259,474
                     Transfer/Repayment to Colleyville Tomorrow Fund              44,286           44,286           44,286                 0                0               0                0
                     Transfer for future vehicle replacement                            0          81,100           81,100           81,100           81,100           81,100           81,100
                     Compensation Adjustment (merit pool)                               0          29,711           31,000                 0                0               0                0
                     Debt Service                                                359,900          157,325                 0                0                0               0                0
                   TOTAL EXPENDITURES                                       13,872,032       15,526,542       16,405,604       17,508,768       18,291,920       19,159,354       20,083,710

                   ENDING WORKING CAPITAL - 9/30                               4,253,847        4,494,686        4,494,687        4,494,687       4,494,687        4,494,687        4,494,688

                   Notes:
                   1. In FY 2017 the Utility Fund was divided into a Utility Operating Fund (shown here) and a Utility Capital Projects Fund (to separately track resources for
                   utility capital projects).  FY 2017 numbers shown here have been adjusted for consistent comparison across years.  Depreciation expenses are not
                   2. Year-end operating surpluses are transferred to the Utility Capital Projects Fund for future utility capital projects.  100 days of reserves are maintained
                   in the Utility Operating Fund.
                   3. In FY 2018, all Utility Fund debt was paid off by the City of Colleyville. The City is working to make a complete transition to a cash funded strategy.


                                                                                                                                                                                                  144
   141   142   143   144   145   146   147   148   149   150   151